Corsair Vengeance Pro Review: 2x8 GB at DDR3-2400 10-12-12 1.65 V
by Ian Cutress on December 13, 2013 2:00 PM ESTCPU Real World
As mentioned previously, real world testing is where users should feel the benefits of spending more on memory. A synthetic test exacerbates a specific type of loading to get peak results in terms of memory read/write and latency timings, most of which are not indicative of the pseudo random nature of real-world workloads (opening email, applying logic). There are several situations which might fall under the typical scrutiny of a real world loading, such as video conversion/video editing. It is at this point we consider if the CPU caches are too small and the system is relying on frequent memory accesses because the CPU cannot be fed with enough data. It is these circumstances where memory speed is important, and it is all down to how the video converter is programmed rather than just a carte blanche on all video converters benefitting from memory. As we will see in the IGP Compute section of this review, anything that can leverage the IGP cores can be a ripe candidate for increased memory speed.
Our tests in the CPU Real World section come from our motherboard reviews in order to emulate potential scenarios that a user may encounter.
USB 3.0 Copy Test with MaxCPU
We transfer a set size of files from the 120GB OCZ Vertex3 connected via SATA 6 Gbps on the motherboard to the 240 GB OCZ Vertex3 SSD with a SATA 6 Gbps to USB 3.0 converter via USB 3.0 using DiskBench, which monitors the time taken to transfer. The files transferred are a 9.2 GB set of 7539 files across 1011 folders – 95% of these files are small typical website files, and the rest (90% of the size) are precompiled installers. In an update to pre-Z87 testing, we also run MaxCPU to load up one of the threads during the test which improves general performance up to 15% by causing all the internal pathways to run at full speed.
Results are represented as seconds taken to complete the copy test, where lower is better.
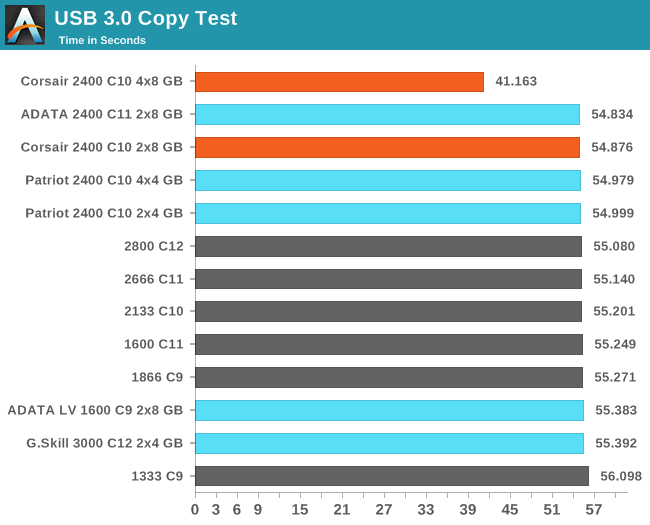
Our CPU copy results are not wholly unexpected, given our previous Ivy Bridge and Thunderbolt copy testing. When initiating a copy from one device to another, if the whole of the copy can fit into memory, it does so while the copy takes place and is faster. It would seem that when there is not enough memory, the system has to wait until a portion of the copy has finished before freeing up the system memory to be written to again. This has consequences, and thus when moving a lot of data around, having a large DRAM allocation can help (unless you go over the limit with a copy, and then almost all memory performs the same).
WinRAR 4.2
With 64-bit WinRAR, we compress the set of files used in the USB speed tests. WinRAR x64 3.93 attempts to use multithreading when possible, and provides as a good test for when a system has variable threaded load. WinRAR 4.2 does this a lot better! If a system has multiple speeds to invoke at different loading, the switching between those speeds will determine how well the system will do.
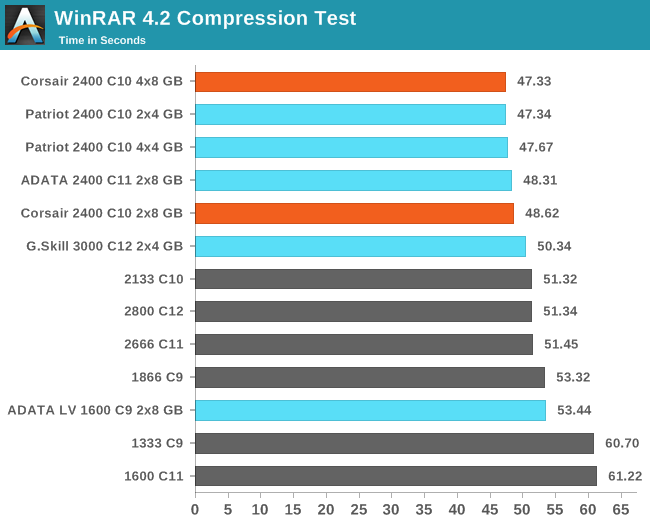
WinRAR seems to like high PI kits.
FastStone Image Viewer 4.2
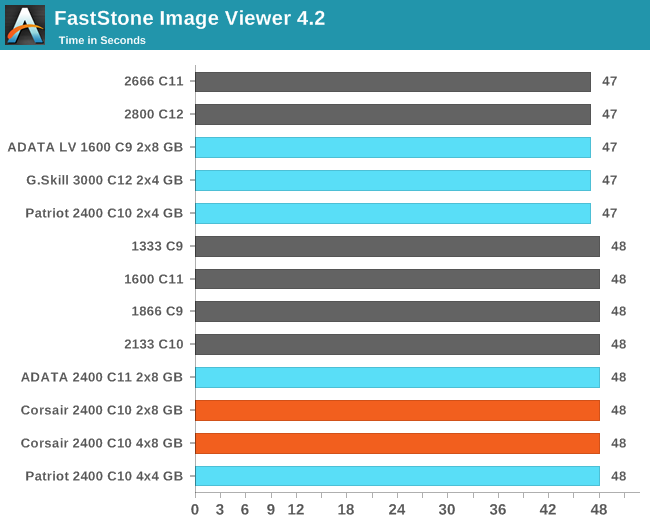
FastStone Image Viewer is a free piece of software I have been using for quite a few years now. It allows quick viewing of flat images, as well as resizing, changing color depth, adding simple text or simple filters. It also has a bulk image conversion tool, which we use here. The software currently operates only in single-thread mode, which should change in later versions of the software. For this test, we convert a series of 170 files, of various resolutions, dimensions and types (of a total size of 163MB), all to the .gif format of 640x480 dimensions. Results shown are in seconds, lower is better.
Xilisoft Video Converter 7
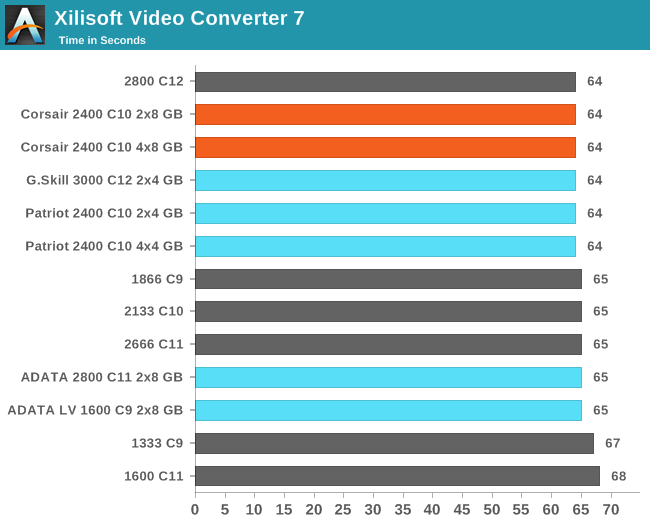
With XVC, users can convert any type of normal video to any compatible format for smartphones, tablets and other devices. By default, it uses all available threads on the system, and in the presence of appropriate graphics cards, can utilize CUDA for NVIDIA GPUs as well as AMD WinAPP for AMD GPUs. For this test, we use a set of 33 HD videos, each lasting 30 seconds, and convert them from 1080p to an iPod H.264 video format using just the CPU. The time taken to convert these videos gives us our result in seconds, where lower is better.
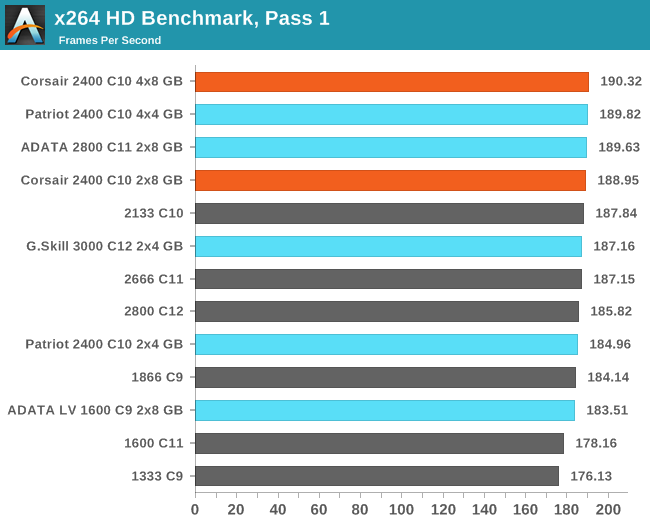
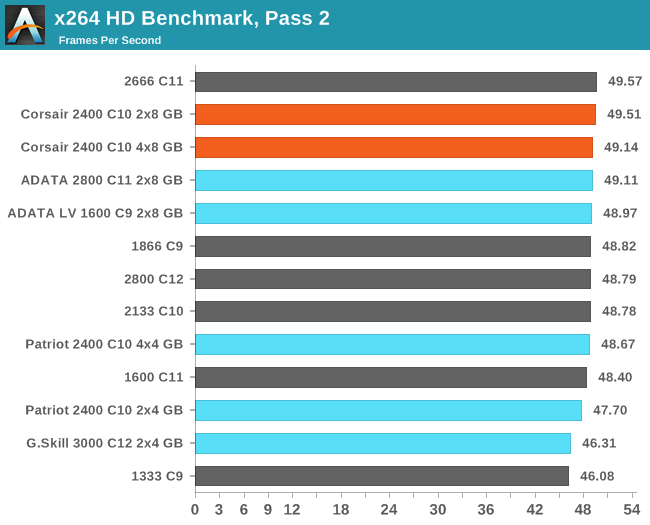
Video Conversion - x264 HD Benchmark
The x264 HD Benchmark uses a common HD encoding tool to process an HD MPEG2 source at 1280x720 at 3963 Kbps. This test represents a standardized result which can be compared across other reviews, and is dependent on both CPU power and memory speed. The benchmark performs a 2-pass encode, and the results shown are the average frame rate of each pass performed four times. Higher is better this time around.
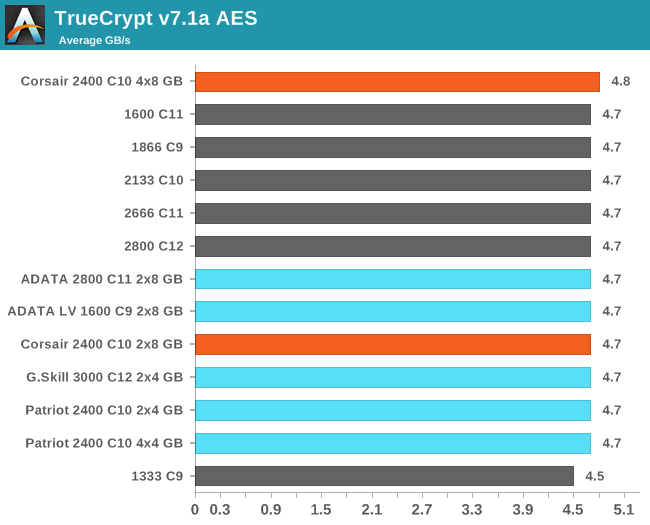
TrueCrypt v7.1a AES
One of Anand’s common CPU benchmarks is TrueCrypt, a tool designed to encrypt data on a hard-drive using a variety of algorithms. We take the program and run the benchmark mode using the fastest AES encryption protocol over a 1GB slice, calculating the speed in GB/s. Higher is better.


26 Comments
View All Comments
UltraWide - Friday, December 13, 2013 - link
On this page:http://www.anandtech.com/show/7575/corsair-vengean...
What are the exact voltages each timing/subtiming? You only list the subtimings and peak MHz, but no voltages.
JoannWDean - Saturday, December 14, 2013 - link
my buddy's aunt earned 14958 dollar past week. she been working on the laptop and got a 510900 dollar home. All she did was get blessed and put into action the information leaked on this site... http://cpl.pw/OKeIJoteiva - Thursday, January 2, 2014 - link
My pet cat's been earning $14823 a month just by eating Whiskas biscuits dipped in cream from albino goats that only sleep in a northerly direction loljeffrey - Friday, December 13, 2013 - link
Ian Cutress,Hello! This is another article stating 1866/C9 being the minimum for Haswell and to avoid 1600 or less. Even going so far as to say, "Any kit 1600 MHz or less is usually bad news."
However, this ignores 1600/C8 modules. The 1600/C8 score a 200 on your Performance Index at stock timings. This is at your recommended 200 level. There are several kits of 2x4 GB 1600/C8 on Newegg that have memory profiles of 8-8-8-24 at 1.5v. I'll repeat, these 1600 8-8-8-24 1.5v kits score 200 on the Performance Index and hit the current memory sweet spot for most people of 2x4 GB. This scores within around 3% of the 1866/C9 kits which have a Performance score of 207.
The reason I bring this up is that the 1600 8-8-8-24 kits are often less expensive than the 1866/C9 kits and offer essentially all of the performance.
I enjoy reading your articles and appreciate how active you have been lately!
jeffrey - Friday, December 13, 2013 - link
Here is an example of a great value for a 2x4 GB kit. This item has 500+ positive reviews and normally sells out when it goes on sale (as it is now).1600 MHz 8-8-8-24 1.5V
http://www.newegg.com/Product/Product.aspx?Item=N8...
fractal9 - Friday, December 13, 2013 - link
Where in the article does it state this? These days I want the most compatibility and reliability, and that means being in the JEDEC standard and at 1.5v. I don't care about a few extra fps or synthetic performance figures, I'll save my $80 and enjoy increased stability.Senti - Friday, December 13, 2013 - link
"we are not going to set any records" with tRFC at 10? lol, sure we would! Do you actually understand the timings you are writing about? Real tRFC is the line above where the numbers are near 300. Now we have huge table of timings that is totally useless because we can't trust it at all...Btw, your spam filter is awful – looks like it blocked my (dynamic) IP for unknown reason.
Hairs_ - Friday, December 13, 2013 - link
Oh dear god. Not this again. It is time for a thorough debunking, based on the data presented, because clearly it is not going to stop.Established from Anandtech's own testing data:
There is no distinguishable, patternable difference between 8GB and 16GB memory kits. In some cases, there is a swing one way or the other, but nothing is consistent.
I think that most enthusiasts would recommend, if asked by a friend on a midrange budget, a 1600 8gb kit. The lowest price for that at C9 timings on newegg is $55. Not the $150 - 250 being bandied about for these moronic kits.
http://www.newegg.com/Product/Product.aspx?Item=N8...
An 1866 C9 16GB kit comes in at ~$115. (It is safe to assume that *some* kit will always be on offer.)
http://www.newegg.com/Product/Product.aspx?Item=N8...
So let's look at the conclusive data:
From all the graphs, we can conclude the difference between the Best "stupid" kit and a reasonable 1600 c9 kit is:
Average 2.78%
Max 13.27%
Min 0.00%
The best results for the stupid kits are:
13.27% running Explicit Finite Solver (3d only, the 2d result was 3.3%) on an IGP. Anyone running this is not using an IGP to do it, I suspect.
12.91% on USB3 copy. The page for those results states they are pulled from the Motherboard reviews, so there's no indication this speed isn't motherboard specific rather than memory specific (as some AsRock boards have USB boost which allegedly seems to work). One result on this same test had a 34.55% lead, but it had the same lead (or larger) on "faster" kits than the 1600 kit, so I am treating this as an outlier.
The vast majority of the results are just not in the stupid kit's favour.
Test Difference Best Stupid Kit 1600 C9 Kit Testing
Graph 1 5.67% 12.86 12.17 IGP
Graph 2 1.66% 9.2 9.05 IGP
Graph 3 4.65% 9 8.6 IGP
Graph 4 1.29% 105.39 104.05 Direct
Graph 5 1.47% 62.94 62.03 Direct
Graph 6 1.28% 47.4 46.8 Direct
Graph 7 0.41% 49.55 49.35 Direct
Graph 8 3.14% 212.5 206.03 Weird triple unbalanced which won't ever occur
Graph 9 3.13% 123.93 120.17 Weird triple unbalanced which won't ever occur
Graph 10 1.04% 91 90.06 Weird triple unbalanced which won't ever occur
Graph 11 5.86% 113.85 107.55 Weird triple unbalanced which won't ever occur
Graph 12 1.00% 54.834 55.383 CPU - From MOBO reviews so no indication if same testbed was used
Graph 13 12.91% 47.33 53.44 CPU - From MOBO reviews so no indication if same testbed was used or if MOBO had USB speed boost.
Graph 14 0.00% 47 47 CPU - From MOBO reviews so no indication if same testbed was used
Graph 15 1.56% 64 65 CPU - From MOBO reviews so no indication if same testbed was used
Graph 16 3.71% 190.32 183.51 CPU - From MOBO reviews so no indication if same testbed was used
Graph 17 1.23% 49.57 48.97 CPU - From MOBO reviews so no indication if same testbed was used
Graph 18 2.13% 4.8 4.7 CPU - From MOBO reviews so no indication if same testbed was used
Graph 19 0.10% 132.06 131.93 CPU Compute
Graph 20 1.59% 755.04 743.25 CPU Compute
Graph 21 0.01% 38.793 38.791 CPU Compute
Graph 22 0.45% 1354 1348 CPU Compute
Graph 23 1.32% 613 605 CPU Compute
Graph 24 1.33% 152 150 CPU Compute
Graph 25 3.31% 1780 1723 IGP Compute
Graph 26 13.27% 222 196 IGP Compute - Explicit Finite Difference Solver (3d), not something going to run on an IGP…
Graph 27 2.49% 150.653 146.993 IGP Compute
Graph 28 1.93% 50.731 49.769 IGP Compute
Graph 29 2.60% 7103 6923 IGP Compute
Hairs_ - Friday, December 13, 2013 - link
The "Weird triple unbalanced" above refers to the idea that there is some lunatic out there running a 4 generation old Dual GPU card in crossfire with a different, single GPU from the same generation but a different spec. This is referred to as "esoteric" but I think it's safe to assume that the only person doing this is someone who has video cards sitting in a pile next to a testbed because they're a video card reviewer.Suffice to say I don't think this test is representative of any real world use pattern, but then neither are a lot of the tests where the stupid kits "shine" (if you can call 12% advantage for a 300% price premium "shining").
fluxtatic - Saturday, December 14, 2013 - link
The 5970 and 5870 are the same GPU. It might have been interesting to see if downclocking the 5870 to match the 5970 made any difference, but this isn't as odd as you seem to think. I would guess a 3- or 4- card tri- or quad-Crossfire setup would be less common, given that it isn't easy to find motherboards that can take 3 or 4 dual-slot cards.It's slightly skewed in that the setup is current-gen other than the video cards, but it is similar to the way quite a few people build. They don't necessarily build a brand-new box every couple years, but replace modularly - I went from an AM3 board with an Athlon64 processor to a PhenomII, to an AM3+ board (which necessitated a RAM upgrade), then replaced the video card twice. My video card is 3 generations old, but handles what I play just fine, so next time around will be another processor upgrade.
Intel-land is a little different, since they change sockets more frequently and a lot of people didn't see it worth the expense to upgrade when there was socket compatibility (SB -> IB, for example), but this setup doesn't strike me as that unusual. If I dropped the kind of money it takes to get a triple Crossfire setup, I'd hang onto it until the games I played started to overwhelm it.