ASUS Silent Square Pro: Compact Embedded-Fan Heatpipe Tower
by Wesley Fink on April 16, 2007 2:30 AM EST- Posted in
- Cases/Cooling/PSUs
Overclocking
As cooling solutions do a better job of keeping the CPU at a lower temperature, it is reasonable to expect the overclocking capabilities of the CPU will increase. In each test of a cooler we measure the highest stable overclock of a standard X6800 processor under the following conditions:
CPU Multiplier: 14x (Stock 11x)
CPU voltage: 1.5875V
FSB Voltage: 1.30V
Memory Voltage: 1.90V
nForce SPP Voltage: 1.35V
nForce MCP Voltage: 1.7V
HT nForce SPP <-> MCP: Auto
Memory is set to Auto timings on the 680i and memory speed is linked to the FSB for the overclocking tests. This removes memory as any kind of impediment to the maximum stable overclock. Linked settings on the 680i are a 1066FSB to a memory speed of DDR2-800. As FSB is raised the linked memory speed increases in proportion. The same processor is used in all cooling tests to ensure comparable results.
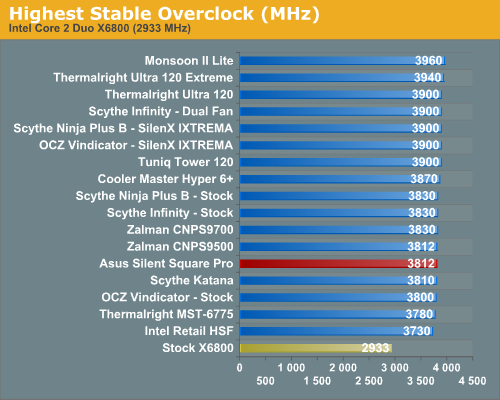
The ASUS Silent Square Pro could only reach 3.81 GHz overclock with stability. This is a poor performance for a cooler targeted at the gaming market. These results are not comparable to the top tier of the heatpipe towers tested, where most top heatpipe towers reach 3.90 GHz with the same CPU and 3.94 GHz for the top performing cooler.
The design of the cooler is very similar to the Tuniq Tower 120, which suggests the ASUS Silent Square Pro should be an effective design. These results were with our modified installation that lowered temperatures, so the comparatively poor results cannot be blamed on a poor mount. We suspect that the performance is hampered by the smaller 90mm fan, which has to work harder to move air due to the smaller size. The odd 90mm fan size also makes replacing the 49.6 CFM fan with something better an unlikely event. It will be difficult to find any fans that will fit the Silent Square Pro. The smaller heatsink size is also a possibly factor in the lower cooling performance.
As cooling solutions do a better job of keeping the CPU at a lower temperature, it is reasonable to expect the overclocking capabilities of the CPU will increase. In each test of a cooler we measure the highest stable overclock of a standard X6800 processor under the following conditions:
CPU Multiplier: 14x (Stock 11x)
CPU voltage: 1.5875V
FSB Voltage: 1.30V
Memory Voltage: 1.90V
nForce SPP Voltage: 1.35V
nForce MCP Voltage: 1.7V
HT nForce SPP <-> MCP: Auto
Memory is set to Auto timings on the 680i and memory speed is linked to the FSB for the overclocking tests. This removes memory as any kind of impediment to the maximum stable overclock. Linked settings on the 680i are a 1066FSB to a memory speed of DDR2-800. As FSB is raised the linked memory speed increases in proportion. The same processor is used in all cooling tests to ensure comparable results.
The ASUS Silent Square Pro could only reach 3.81 GHz overclock with stability. This is a poor performance for a cooler targeted at the gaming market. These results are not comparable to the top tier of the heatpipe towers tested, where most top heatpipe towers reach 3.90 GHz with the same CPU and 3.94 GHz for the top performing cooler.
The design of the cooler is very similar to the Tuniq Tower 120, which suggests the ASUS Silent Square Pro should be an effective design. These results were with our modified installation that lowered temperatures, so the comparatively poor results cannot be blamed on a poor mount. We suspect that the performance is hampered by the smaller 90mm fan, which has to work harder to move air due to the smaller size. The odd 90mm fan size also makes replacing the 49.6 CFM fan with something better an unlikely event. It will be difficult to find any fans that will fit the Silent Square Pro. The smaller heatsink size is also a possibly factor in the lower cooling performance.


24 Comments
View All Comments
Avalon - Tuesday, April 17, 2007 - link
Good review. Useless cooler.I'm still going to throw my vote out there for you guys possibly reviewing the Coolermaster HyperTX. That thing is supposed to cool extremely well while providing awesome mosfet cooling.
poohbear - Monday, April 16, 2007 - link
thanks for the review as heatsink reviews are always good to see! however, could u start using bar graphs in your reviews as they're MUCH easier to read then the ones u choose to use. Much simpler to view the info instead of sifting through all the names on the side and numbers on the right. please and thank u.Wesley Fink - Monday, April 16, 2007 - link
The bar graph idea sounds good, but the charts are trend line charts with 4 or 5 points for each cooler and fan configuration. It would take at least 5 bar graphs to replace each chart, and then the trend would also be lost. We have added a "click to enlarge" feature to the charts to make them more usable for those who closely scrutinize the temperature data.Frumious1 - Monday, April 16, 2007 - link
Every now and then some whiner will come along and dislike the scaling graphs, Wes. Just ignore them! Anyone that can't understand the intent of a scaling graph needs a lesson in reading comprehension anyway. My only thought is maybe some sorting of the data in the scaling graphs would be useful. They crurently seem to be sorted by when you reviewed the coolers, and most people probably could care less about the chronological aspects.At some point, you're going to need to start dropping coolers from those scaling graphs as well. That's my opinion at least - they're already very crowded! Maybe select the "best" coolers (or just a reasonable baseline group) and just leave those in the scaling graphs, with the complete list of coolers in the other charts? You could have the Thermalright Ultra 120 Extreme (is that out yet!?), Tuniq 120, Cooler Master Hyper 6+, Monsoon Lite II, Scythe Ninja B, and the lowly Intel retail. Then just add the specific cooler being tested. Right now there's definitely an "information overload" aspect ot the scaled charts, and it will only get worse with time as more HSFs are added.
/$0.02
strikeback03 - Monday, April 16, 2007 - link
Or possibly the best few coolers in each price bracket, along with the tested cooler, and a link to a large image of all of the tested coolers. Something interactive, where you could turn individual coolers on and off, whould be nice, though I don't know if there is software that would allow these to be easily made.JarredWalton - Monday, April 16, 2007 - link
I know our graphing engine is currently undergoing some development/design work, but when that will be complete and what it will offer I do not yet know. If we could get something interactive, that would be pretty cool. Right now, our engine doesn't handle scaling graphs at all, which is why we just use Excel to generate those manually. We can hope, though! :)NARC4457 - Monday, April 16, 2007 - link
It feels like the noise measurement methodology needs a tweak since there are many coolers that are sitting right at the noise floor. I know that you are testing these in real-world conditions, with components that enthusiasts are likely to use. But I guess it just feels like the test is becoming less meaningful if the results are the same across many coolers.I don't really have a suggestion here, because I don't think people would like it either if you simply stated that the cooler was not louder than ambient without showing the method and
Wesley Fink - Monday, April 16, 2007 - link
We will be revamping our test bed when we do the 120mm fan roundup. We are currently evaluatig components to find a little lower noise floor and to priduce some consistent test methods that don't get spoofed by variable speed PS fans. Thanks for your comments.flipmode - Monday, April 16, 2007 - link
Thanks for another HSF article - these are valuable contributions to the enthusiast scene. But I have to ask if you can start cropping and upscaling your graphs - they're darn near unreadable now that you've made such a wonderful effort to test 20 coolers. I want to actually be able to read what you've take the time to present.Scythe Ninja Fanboy
crimson117 - Monday, April 16, 2007 - link
Or provide a link to a larger version of each graph.