Intel Atlas Canyon (NUC11ATKPE) and GEEKOM MiniAir 11 UCFF PCs Review: Desktop Jasper Lake Impresses
by Ganesh T S on July 14, 2022 8:00 AM ESTSystem Performance: Multi-Tasking
One of the key drivers of advancements in computing systems is multi-tasking. On mobile devices, this is quite lightweight - cases such as background email checks while the user is playing a mobile game are quite common. Towards optimizing user experience in those types of scenarios, mobile SoC manufacturers started integrating heterogeneous CPU cores - some with high performance for demanding workloads, while others were frugal in terms of both power consumption / die area and performance. This trend is now slowly making its way into the desktop PC space.
Multi-tasking in typical PC usage is much more demanding compared to phones and tablets. Desktop OSes allow users to launch and utilize a large number of demanding programs simultaneously. Responsiveness is dictated largely by the OS scheduler allowing different tasks to move to the background. Intel's Alder Lake processors work closely with the Windows 11 thread scheduler to optimize performance in these cases. Keeping these aspects in mind, the evaluation of multi-tasking performance is an interesting subject to tackle.
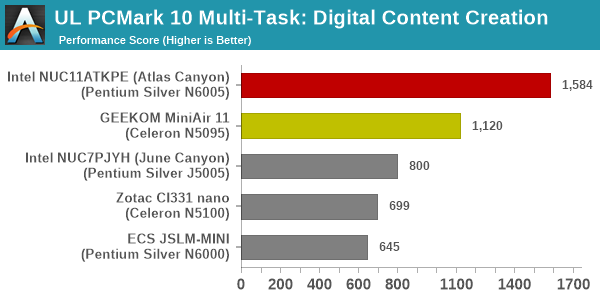
We have augmented our systems benchmarking suite to quantitatively analyze the multi-tasking performance of various platforms. The evaluation involves triggering a VLC transcoding task to transform 1716 3840x1714 frames encoded as a 24fps AVC video (Blender Project's 'Tears of Steel' 4K version) into a 1080p HEVC version in a loop. VLC internally uses the x265 encoder, and the settings are configured to allow the CPU usage to be saturated across all cores. The transcoding rate is monitored continuously. One complete transcoding pass is allowed to complete before starting the first multi-tasking workload - the PCMark 10 Extended bench suite. A comparative view of the PCMark 10 scores for various scenarios is presented in the graphs below. Also available for concurrent viewing are scores in the normal case where the benchmark was processed without any concurrent load, and a graph presenting the loss in performance.
| UL PCMark 10 Load Testing - Digital Content Creation Scores | |||
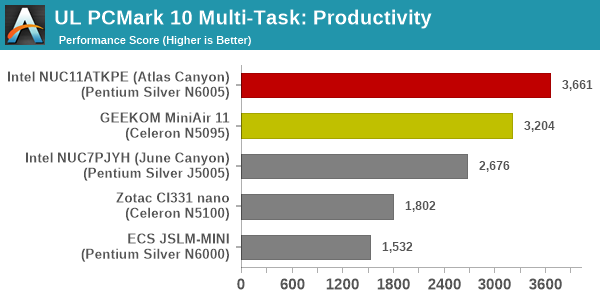
| UL PCMark 10 Load Testing - Productivity Scores | |||
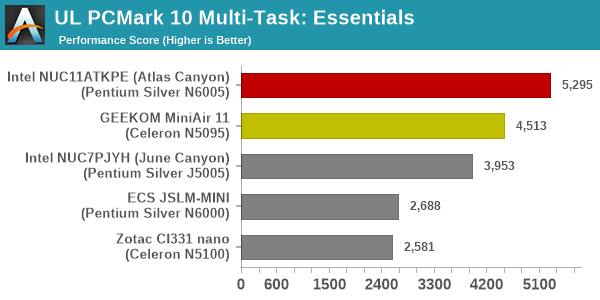
| UL PCMark 10 Load Testing - Essentials Scores | |||
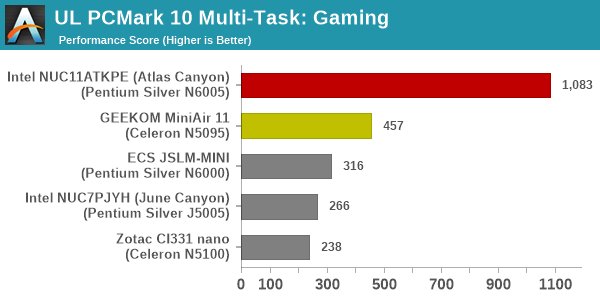
| UL PCMark 10 Load Testing - Gaming Scores | |||
| UL PCMark 10 Load Testing - Overall Scores | |||
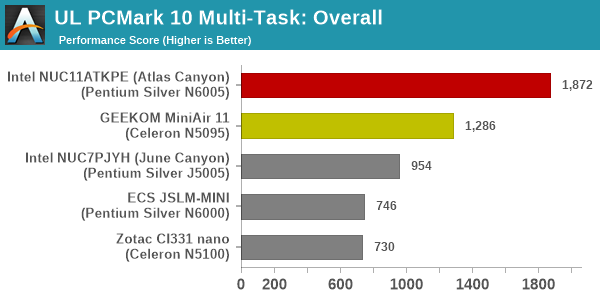
The MiniAir 11 turns out to be the best at handing the concurrent transcoding load - the loss in performance for various workloads is minimal, and allow it to slot in just behind the Atlas Canyon NUC across the board.
Following the completion of the PCMark 10 benchmark, a short delay is introduced prior to the processing of Principled Technologies WebXPRT4 on MS Edge. Similar to the PCMark 10 results presentation, the graph below show the scores recorded with the transcoding load active. Available for comparison are the dedicated CPU power scores and a measure of the performance loss.
| Principled Technologies WebXPRT4 Load Testing Scores (MS Edge) | |||
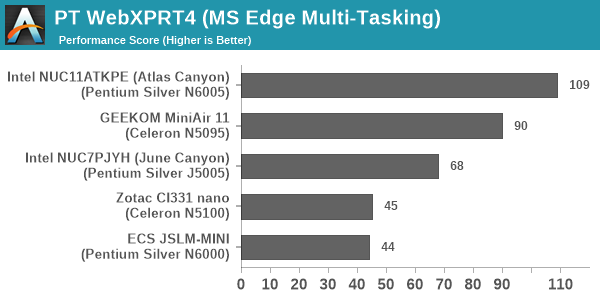
Addition of the transcoding load overwhelms the ECS JSLM-MINI - this causes it to slip well below the MiniAir 11 in the WebXPRT 4 workload. The MiniAir 11 moves up one spot to slot in behind the Atlas Canyon NUC.
The final workload tested as part of the multitasking evaluation routine is CINEBENCH R23.
| 3D Rendering - CINEBENCH R23 Load Testing - Single Thread Score | |||

| 3D Rendering - CINEBENCH R23 Load Testing - Multiple Thread Score | |||
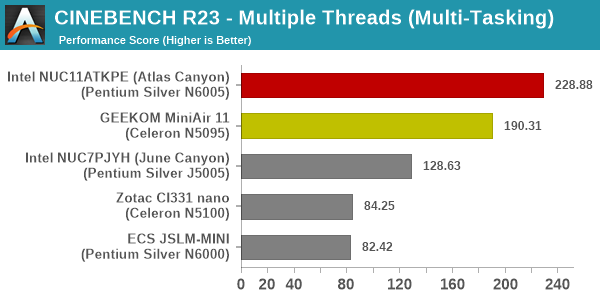
Addition of transcoding load lowers the 3D rendering performance, as expected. However, the relative ordering of the systems doesn't change.
After the completion of all the workloads, we let the transcoding routine run to completion. The monitored transcoding rate throughout the above evaluation routine (in terms of frames per second) is tabulated below.
| VLC Transcoding Rate (Multi-Tasking Test) - Frames per Second | |||||
| Enc. Pass #1 | PCMark 10 | WebXPRT4 | Cinebench | Enc. Pass #2 | |
| Intel NUC11ATKPE (Atlas Canyon) (Pentium Silver N6000) |
0.5224 | 0.5035 | 0.4133 | 0.4986 | 0.5243 |
| GEEKOM MiniAir 11 (Pentium Silver N6000) |
0.4543 | 0.4507 | 0.3674 | 0.4287 | 0.4608 |
The transcoding rates drop down with simultaneous loading, as expected. Both systems are actively-cooled. So, there is no extra throttling at play here, and the first and last encoding passes (which are free of other loads) have approximately the same transcoding rate.


21 Comments
View All Comments
flgt - Thursday, July 14, 2022 - link
Nice article. I don’t like how so much performance is driven by relatively hidden PL1/PL2 settings. Have regular NUC12’s been released yet?AdrianBc - Friday, July 15, 2022 - link
Intel has developed a "Wall Street Canyon" NUC with Alder Lake P, as a replacement for the NUC 11 Pro with Tiger Lake, and which has about the same interfaces but with a much faster CPU.Photos of working prototypes have been leaked, but the launch of the product has been delayed for unknown causes, maybe component shortages. Nevertheless, I do not believed that it will be canceled, but maybe it will be launched later this year.
A very similar NUC-like barebone is already available from ASRock Industrial, as "NUC BOX-12xxP", e.g. "NUC BOX-1260xP", which, compared to Intel, has dual 2.5G Ethernet instead of single 2.5G Ethernet, and 3 DisplayPort (2 on TB) + 1 HDMI instead of 2 DisplayPort (both on TB) + 2 HDMI.
AdrianBc - Friday, July 15, 2022 - link
Sorry, I have pressed "Submit" without rereading and there are a couple of typos.The names for the ASRockInd alternatives are "NUC BOX-1260P", "NUC BOX-1240P", etc.
mode_13h - Friday, July 15, 2022 - link
OMG. I thought "Wall Street Canyon" NUC was a joke. Still funny, though.Sivar - Thursday, July 14, 2022 - link
Some means to compare these values vs. a full desktop CPU would be helpful. In isolation, I can see that the Pentium Silver N6005 is much faster than the J5005, but I have no idea if it is 90% the performance of a desktop CPU, or 60%, or 4%, etc.Perhaps a link to a reasonably comparable desktop CPU review.
mode_13h - Friday, July 15, 2022 - link
> Some means to compare these values vs. a full desktop CPU would be helpful.100% agree. We do have a few data points, however. Using data from https://www.anandtech.com/show/17231/the-intel-cor... we can see:
CineBench R23: Single-threaded
-----------------
NUC11ATKPE: 716
Ryzen 3 5300G: 1338
Ryzen 5 5600G: 1434
i3-12300: 1705
CineBench R23: Mulitthreaded
-----------------
NUC11ATKPE: 2521
Ryzen 3 5300G: 6770
Ryzen 5 5600G: 10601
i3-12300: 8598
Obviously, software rendering is not the kind of workload Tremont is optimized for.
Next, there's Handbrake, but the i3-12300 article used version 1.3.2 and this uses 1.5.1. Without at least a benchmark of the same hardware on both versions, we can't know how much variation is introduced by the new software version.
7-zip might have a similar version difference (earlier article references "1900", while this one uses 21.7), and it's not clear if the test cases are even the same.
And that's basically all the overlap I found. That's less than I thought or hoped for. It's disappointing how much the software versions and format of the results changed, such that I can't even tell whether a given test is using the same workload between the articles.
Hresna - Tuesday, July 19, 2022 - link
Funny, I was just thinking this yesterday. It’s widely impractical I know but perhaps a single chart showing the numbers in context of “modern desktop computing” would add to the general consumption-ability for us casual readers.For so many reviews I end up side-channel trying to look up/remember “ok, what’s my firestrike number again?”.
t.s - Thursday, July 14, 2022 - link
"a 2022 consumer-focused NUC without a single Type-C port is strange to see" LOL. Hello. This is Intel we're talking about, bro.abufrejoval - Thursday, July 14, 2022 - link
Well, you certainly did a much better job than I did with my Atlas Canyon NUC and caught me with quite a few mistakes, too. E.g. I had mis-identified the front panel header hidden under the rubber cap as a USB2 port.I also hadn’t really noticed that PL1/2 had gone to 15/25 in the max performance settings, I guess I was still relying far too much on my Gemini Lake observations.
I’ve never actually observed 25 Watts with HWinfo, the iGPU never goes beyond 5 Watts and the CPU will stay shy of 15 resulting in a 20 Watt total.
For the NUC’s WIFI the most important aspect is that it’s socketed, unlike e.g. on the Tiger Lake NUC11. I had bought a bunch of AX200 cards some time back, because at just €20 they were twice the price of shipping and I replaced the WIFI before I even booted the system.
I got a whole box of below-acceptable WIFI cards, that’s just electronic waste from the factory, because quite a few high-range notebooks also come with such crippling kit.
Likewise, I have another box of RealTek based USB3 2.5 Gbit/s Ethernet adapters, to bring a bit of balance to these systems, which I tend to use with GlusterFS.
I also didn’t have DDR4-2933 SO-DIMMs lying around and was ever so glad the 2x 32GB DDR4-3200 I borrowed from my Tiger Lake NUC11 worked, even if they took quite a bit of time at the initial boot to be configured properly.
DDR4-2400 SO-DIMMS will work just as well and honestly there is very little real difference in performance. The memory bandwidth on Geekbench 4 will change from 16.9/GBs to 17.3GB/s for single core and from 22.2GB/s to 25.6GB/s on multi core. The same DDR4-3200 SO-DIMMs deliver 35.6GB/s single core memory bandwidth with the Tiger Lake’s i7-1165G7 and 39.7GB/s on the multi-core variant, which would almost seem to indicate, that the latest Atom continues to be a single-channel design, like the J5005, N3700 and J1900 predecessors, where the 2nd module never delivered more than a 10% bandwidth increase.
Jasper lake drops to 12.8GB/s with a single module on both the single and the multi core variants of the Geekbench 4 memory bandwidth benchmark and I’m sure the impact on the iGPU would be rather significant, even if I didn’t measure to confirm.
Next I dropped PL1/PL2 to 10/12 Watts (the BIOS won’t allow 10/10) and TAU to 1 second, just to see differentiate properly between the generational improvements of Jasper Lake vs. Goldmont Plus and the additional TDP budget: it barely made a difference on Geekbench 5, whilst HWinfo did confirm that the lower TDP limits were indeed observed.
It takes Prime95 to confirm, that the TDP budget difference has an impact on the clocks, Geekbench is just too light a workload. And in combination with Furmark, you can also nicely observe that the iGPU TDP share is fixed at 5 Watts, while the CPU core have to manage with what’s left at 25 or 15 Watts after TAU.
I do believe the Atlas Canyon NUC11 is a rather good deal for the €200 price, if you can get one. I’ve found a niche dealer here in Germany (minipc.de), that still has dozens in stock but that seems a rare exception. There are still some N6005 based firewall appliances available from China, even fully passive but at closer to €500 before taxes.
Ian started to ruminate on how he’d be able to measure the generational improvements of Grace Mont over Jasper Lake by using Lasso to control CPU core assignments on an Alder Lake base. Too bad he then never got around testing that, because it could have helped to gauge a hypothetical all-E-core chip.
Jasper Lake does rather well against say a Broadwell based Xeon D-1541 at 2.7GHz so it’s easy to see why they are not to keen on seeing these low-end devices compete in the mini-server market. Elkhart Lake Atoms variants which support inline ECC would certainly create an issue, if they sold for a similar price than Jasper Lake (I heavily suspect they are the same silicon). But a SuperMicro mainboard with zero other distinguishing features (e.g. only Gbit Ethernet) is listed at €800, way beyond what I’d want to pay for ECC alone.
mode_13h - Friday, July 15, 2022 - link
> DDR4-2400 SO-DIMMS will work just as well and honestly there is very little real difference in> performance. The memory bandwidth on Geekbench 4 will change from 16.9/GBs to 17.3GB/s
> for single core and from 22.2GB/s to 25.6GB/s on multi core.
> ... the latest Atom continues to be a single-channel design
> Jasper lake drops to 12.8GB/s with a single module on both the single and the multi core
That's a 35% benefit for single-core and a 100% boost for multi-core. Whatever is going on there, I think it's simplistic to say the SoC is simply designed for single-channel.
It's weird that they hampered it, because they're just leaving performance on the table. I wonder if maybe the memory controller is more optimized for LPDDR4 and the regular DDR4 performance is more of an afterthought.
BTW, thanks for your TDP testing, also.