The Corsair SP (Static Pressure), AF (High Airflow) 120/140mm Fan Review
by E. Fylladitakis on November 25, 2015 8:00 AM ESTCorsair's 140mm Performance
AF140 White LED Quiet Edition
As mentioned previously, the variation on Corsair's fans means that this one is our 140mm model in the 'High Airflow' (AF) category, focusing on low-impedance (case-fan style) scenarios. The LED versions are not built as sturdy as the non-LED models, and this one comes in with the 'Quiet Edition' moniker as well. Here are the results for the AF140 LED QE fan at high and low voltage settings:
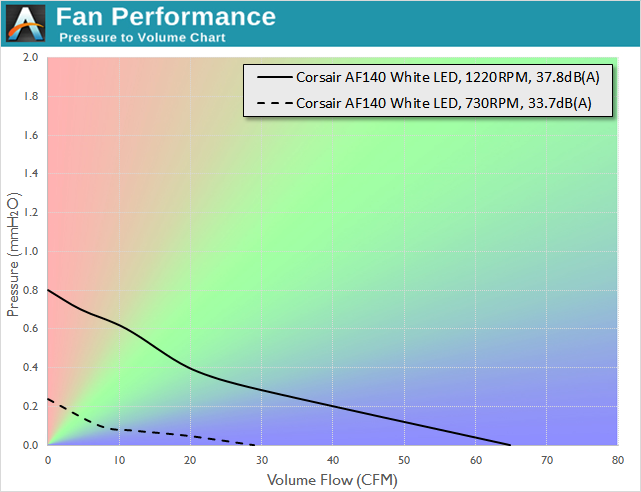
As it can be seen from the above performance chart, the AF140 begins with very low static pressure readings but its airflow increases as the airflow impedance decreases. This increase is dramatic when the airflow impedance pressure drop is below 0.3 mmH2O while the fan is operating at its maximum speed.
SP140 White LED
The Static Pressure line of fans focuses more on the early end of the pressure/volume curve, aiming to get higher airflow at the same pressure while potentially sacrificing the total peak volume flow at zero pressure. Similar to the AF model above, this is a 140mm LED version but not in the quest range. Here are the 12V and 7V results:
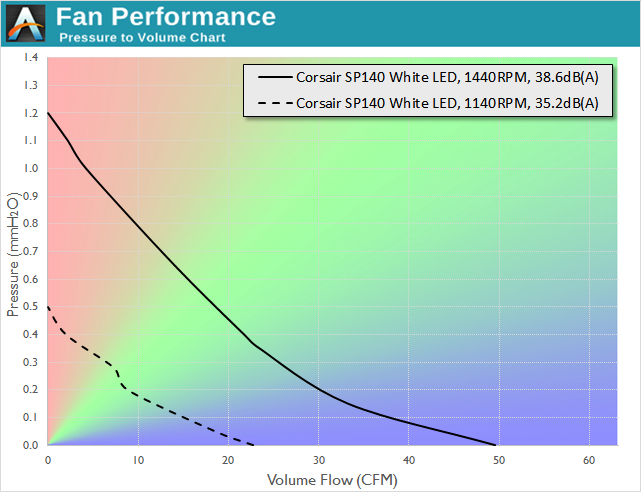
As expected by its design and specifications, the SP140 has a good static pressure, nearly 50% better than that of the high airflow AF140. However, its pressure to flow curve declines faster and the SP140, even though it has a higher maximum speed than the AF140, cannot reach very high airflow values.
Comparing the AF140 LED QE and SP140 LED
If we do a direct comparison at the different voltage modes, we get the following for 12 volts:

Then this is for 7 volts (note the different scales on both axes):
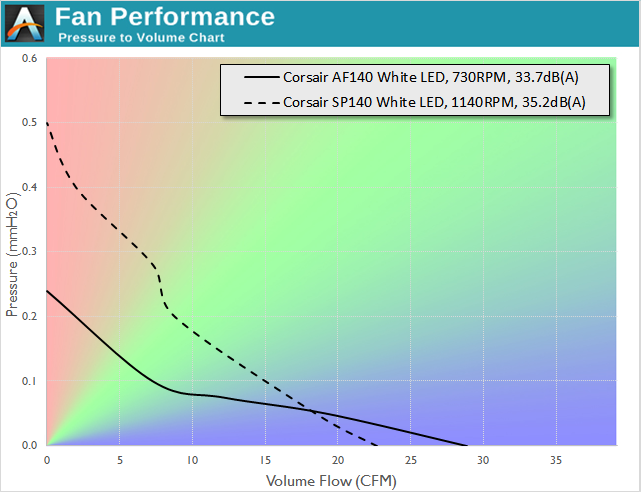
Note that their rotational speeds are not the same at either voltage. Still, the slower AF140 can move greater volumes of air when the airflow impedance pressure drop is below 0.3 mmH2O. However, if the airflow impedance is high, the SP140 will clearly provide better performance.


92 Comments
View All Comments
Gasaraki88 - Tuesday, January 5, 2016 - link
I hate how you change the scale for every single chart. Why leave so much blank space in the CFM scale for some charts but not others? You make the scale all the way up to 120CFM but the max a fan got in the chart was 70 CFM. You could have lowered all the charts to 80CFM scale and it would have been easier to read and compare. I thought they teach these things in math classes in high school.Gasaraki88 - Tuesday, January 5, 2016 - link
But thanks for your hard work with the tests.