Advatronix Nimbus 400 File Server Review
by Ganesh T S on August 12, 2015 8:00 AM EST- Posted in
- NAS
- storage server
- Avoton
- Advatronix
Performance Metrics - Phoronix Test Suite
The file server's BIOS settings allow it boot off a USB key. We had no trouble doing the same with a portable installation of Ubuntu 14.04 (kernel version 3.16).
Database Benchmarks
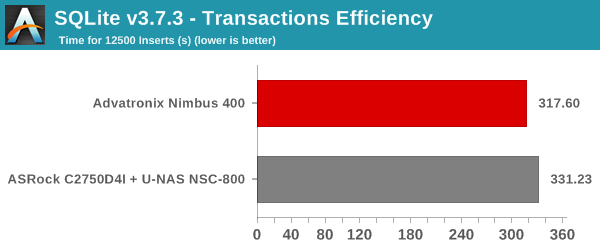
The first test we look at involves determination of the time taken to perform 12500 record insertions into an indexed database. We use SQLite v3.7.3. SQLite performance depends to a large extent on the capabilities of the CPU. Note that the C2750D4I system has a 20W TDP and has more cores / better clocks compared to the C2550D4I in the Nimbus 400. Benchmarks from other systems can be viewed on OpenBenchmarking.org.
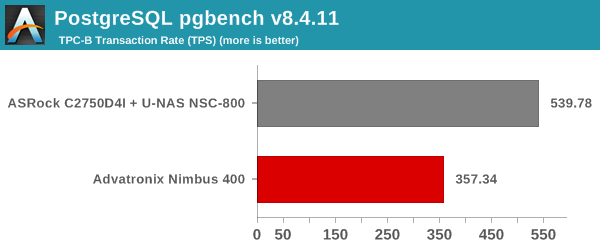
The pgbench database benchmark involves recording the transaction rate for database operations using PostgreSQL. Unlike SQLite insertions-only test, pgbench is based on TPC-B, running five SELECT, UPDATE and INSERT commands per transaction.
Benchmarks from other systems can be viewed on OpenBenchmark.org
Web Server Benchmarks
The NGINX and Apache benchmarks record the number of static web page requests that can be serviced in a given time interval. It gives an idea of the load that can be handled if a given system were to be configured as a web server. The test load consists of a total of 500K requests (for NGINX) / 1M requests (for Apache) with 100 concurrent ones.


Benchmark numbers for both of these are available on OpenBenchmarking.org (NGINX, Apache).
TCP Loopback
The efficiency of the networking stack in the system (not to be confused with the hardware network adapter itself) can be determined by measures the loopback TCP performance. We record the time taken to transfer 10GB of data via loopback.

Given that we have the same networking stack for a given OS release across different hardware configurations, the efficiency is going to vary based solely on the CPU capabilities again. Benchmarks from other systems can be viewed on OpenBenchmarking.org.
CacheBench
CacheBench is an artificial benchmark to determine the performance of the cache and DRAM components in a system. It consists of three profiles - reads, writes and read/modify/writes. The bandwidth is recorded for each profile, with bigger numbers indicating better performance.
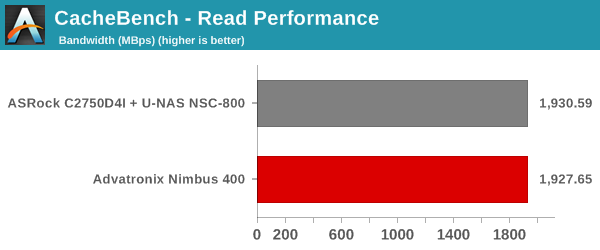

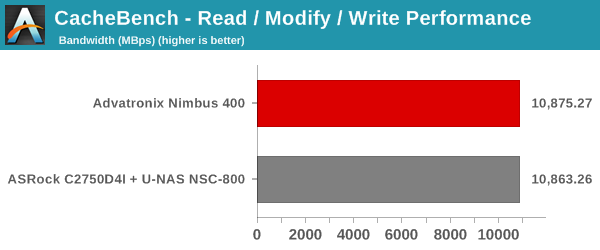
The numbers depend on the internal cache access speeds as well as the speed of the DRAM in the system. Benchmarks from other systems can be viewed on OpenBenchmarking.org
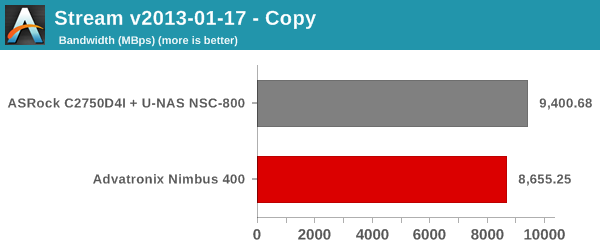
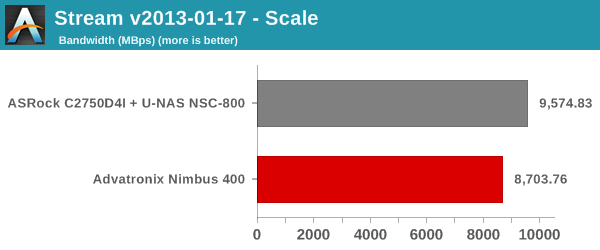
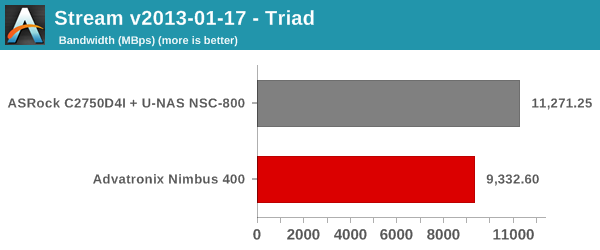
Stream
The system memory is tested out using the stream benchmark. The STREAM benchmark is a simple, synthetic benchmark designed to measure sustainable memory bandwidth (in MB/s) and a corresponding computation rate for four simple vector kernels (Copy, Scale, Add and Triad).

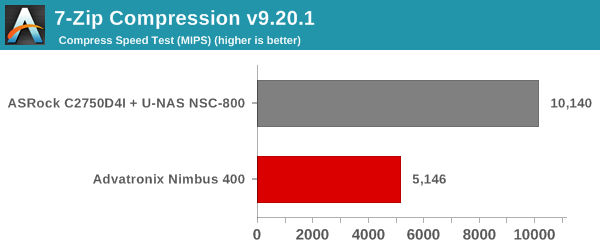
7-Zip Compression
The 7-Zip compression benchmark records the MIPS for the compression mode. This is the same benchmark that we use in the evaluation of mini-PCs, except that this is based on the Linux version. Higher MIPS ratings correspond to better performance, and the numbers are primarily based on the performance of the CPU in the system.
Benchmark numbers for other systems can be viewed on OpenBenchmarking.org
Linux Kernel Compilation
The timed Linux kernel compilation benchmark records the time taken to build the Linux 3.18 kernel. It is a good multi-discipline benchmark, stressing multiple aspects of the system including the DRAM, CPU and, to a certain extent, even the storage.
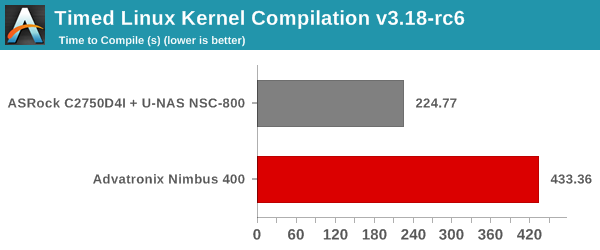
Benchmark numbers for other systems can be viewed on OpenBenchmarking.org
C-Ray
C-Ray is a simple raytracer designed to evaluate the floating point performance of a CPU. This is a multi-threaded test, and the time taken to complete the routine is recorded.
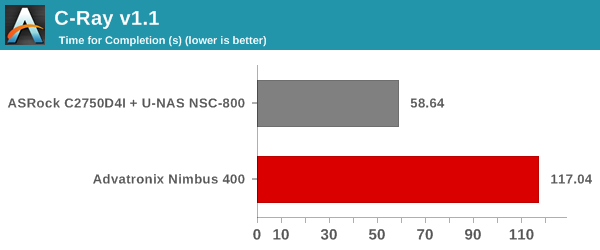
Benchmark numbers for other systems can be viewed on OpenBenchmarking.org


18 Comments
View All Comments
jamyryals - Wednesday, August 12, 2015 - link
This CPU has the "AES New Instructions" which I think would offload most of the encryption costs. In practice, I don't have any experience with it to know either way.http://ark.intel.com/products/77982/Intel-Atom-Pro...
leexgx - Wednesday, August 12, 2015 - link
all the encryption would be done at very high speed with AES hardware in the CPU (assuming the encryption software uses AES like truecrypt does)WithoutWeakness - Wednesday, August 12, 2015 - link
Will you be doing a review of the Nimbus 2000? I've heard it's the fastest model yet!overzealot - Tuesday, August 18, 2015 - link
You're a server, Harry!toyotabedzrock - Wednesday, August 12, 2015 - link
The idle power usage seems very high. Is that while running Windows or Linux?ganeshts - Wednesday, August 12, 2015 - link
That was running Windows Server 2012 R2 with 4x SSDs in the drive bays.bobbozzo - Friday, August 14, 2015 - link
Hi,1. Is the PSU ATX, SFX, or some other standard form factor?
2. is there any dust filter in the front of the case?
Thanks!
DanNeely - Friday, August 14, 2015 - link
It's an ATX PSU. While not a filter per-se the door is a fine mesh that does block a fair amount of dust.