The Intel Broadwell Review Part 2: Overclocking, IPC and Generational Analysis
by Ian Cutress on August 3, 2015 8:00 AM ESTComparing IPC: Discrete Gaming
One of the big marketing elements of a new platform from Intel is the added benefits to gaming. Given the growth of the gaming industry this decade, it makes sense to target one of the most socially active industries going. There is a potential danger here though – a large portion of the current gaming titles reach the law of limiting returns when it comes to frequency and cores. Windows 10 and DirectX 12 based titles on the horizon is hoping to change that to a certain extent, but currently CPU performance on a good enough processor is rarely enough to push some major pixel power, especially in single card scenarios.
For this set of tests, we kept things simple – a low end single R7 240 DDR3, an ex-high end GTX 770 Lightning and a top line GTX 980 on our standard CPU game set under normal conditions.
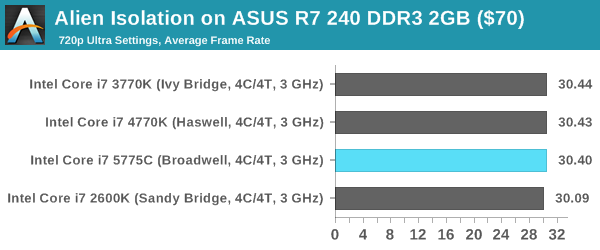
Alien: Isolation
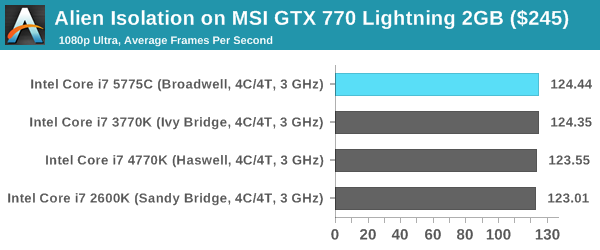
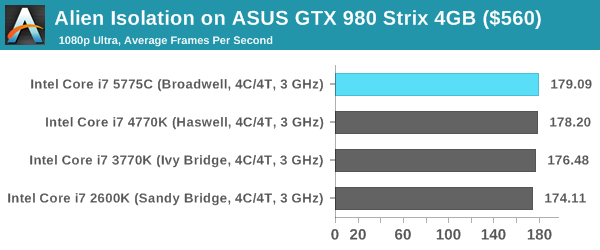
If first person survival mixed with horror is your sort of thing, then Alien: Isolation, based off of the Alien franchise, should be an interesting title. Developed by The Creative Assembly and released in October 2014, Alien: Isolation has won numerous awards from Game Of The Year to several top 10s/25s and Best Horror titles, ratcheting up over a million sales by February 2015. Alien: Isolation uses a custom built engine which includes dynamic sound effects and should be fully multi-core enabled.
For low end graphics, we test at 720p with Ultra settings, whereas for mid and high range graphics we bump this up to 1080p, taking the average frame rate as our marker with a scripted version of the built-in benchmark.

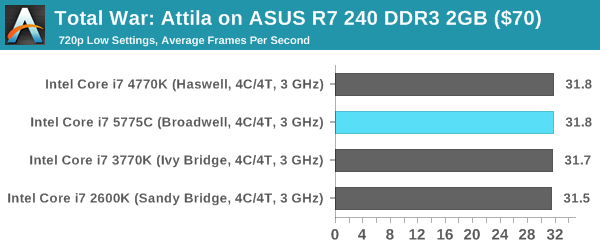
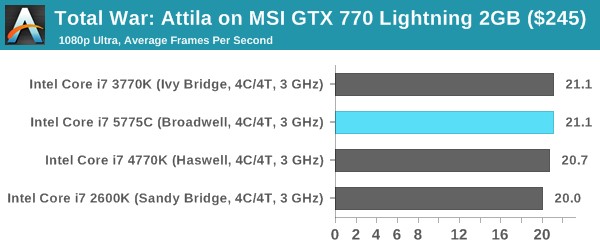
Total War: Attila
The Total War franchise moves on to Attila, another The Creative Assembly development, and is a stand-alone strategy title set in 395AD where the main story line lets the gamer take control of the leader of the Huns in order to conquer parts of the world. Graphically the game can render hundreds/thousands of units on screen at once, all with their individual actions and can put some of the big cards to task.
For low end graphics, we test at 720p with performance settings, recording the average frame rate. With mid and high range graphics, we test at 1080p with the quality setting. In both circumstances, unlimited video memory is enabled and the in-game scripted benchmark is used.


Grand Theft Auto V
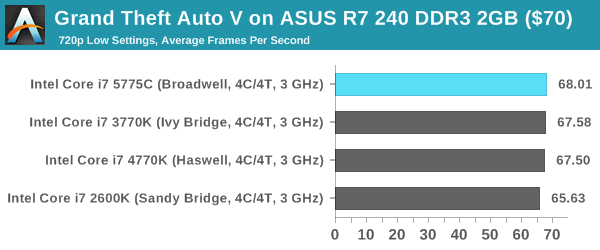
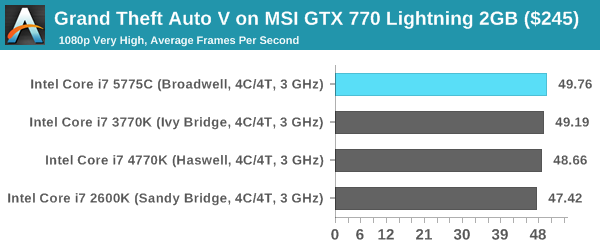
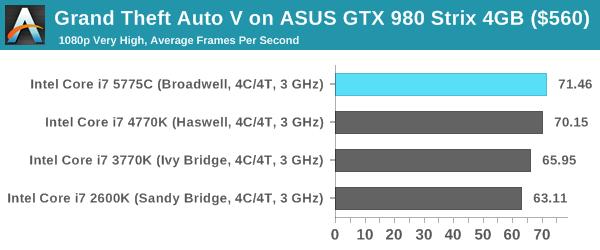
The highly anticipated iteration of the Grand Theft Auto franchise finally hit the shelves on April 14th 2015, with both AMD and NVIDIA in tow to help optimize the title. GTA doesn’t provide graphical presets, but opens up the options to users and extends the boundaries by pushing even the hardest systems to the limit using Rockstar’s Advanced Game Engine. Whether the user is flying high in the mountains with long draw distances or dealing with assorted trash in the city, when cranked up to maximum it creates stunning visuals but hard work for both the CPU and the GPU.
For our test we have scripted a version of the in-game benchmark, relying only on the final part which combines a flight scene along with an in-city drive-by followed by a tanker explosion. For low end systems we test at 720p on the lowest settings, whereas mid and high end graphics play at 1080p with very high settings across the board. We record both the average frame rate and the percentage of frames under 60 FPS (16.6ms).

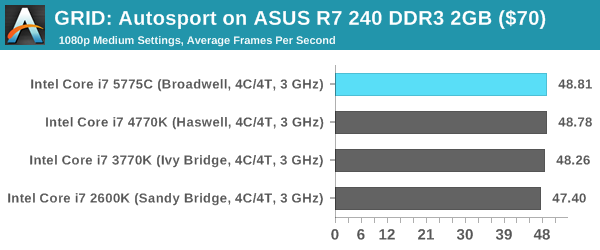
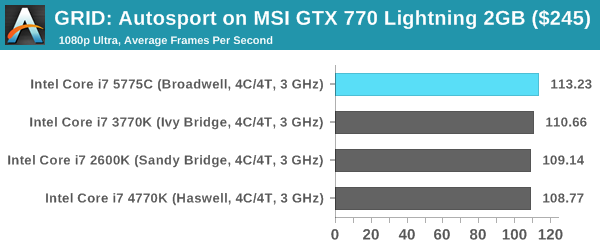
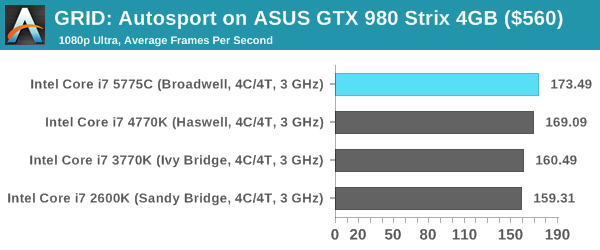
GRID: Autosport
No graphics tests are complete without some input from Codemasters and the EGO engine, which means for this round of testing we point towards GRID: Autosport, the next iteration in the GRID and racing genre. As with our previous racing testing, each update to the engine aims to add in effects, reflections, detail and realism, with Codemasters making ‘authenticity’ a main focal point for this version.
GRID’s benchmark mode is very flexible, and as a result we created a test race using a shortened version of the Red Bull Ring with twelve cars doing two laps. The car is focus starts last and is quite fast, but usually finishes second or third. For low end graphics we test at 1080p medium settings, whereas mid and high end graphics get the full 1080p maximum. Both the average and minimum frame rates are recorded.

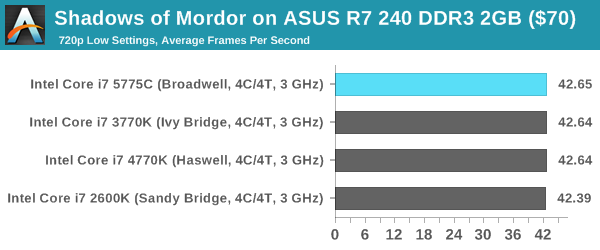
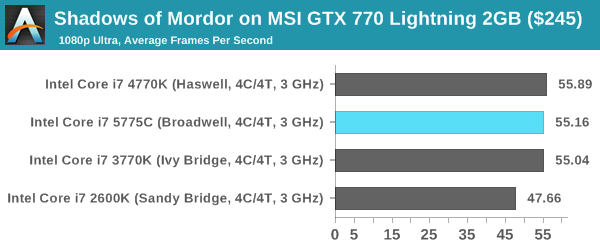
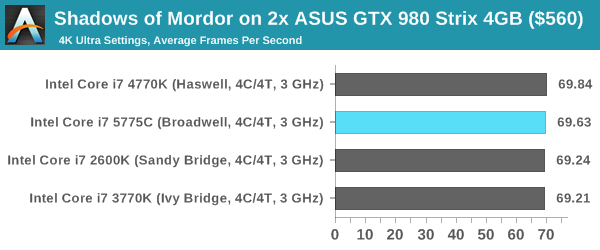
Middle-Earth: Shadows of Mordor
The final title in our testing is another battle of system performance with the open world action-adventure title, Shadows of Mordor. Produced by Monolith using the LithTech Jupiter EX engine and numerous detail add-ons, SoM goes for detail and complexity to a large extent, despite having to be cut down from the original plans. The main story itself was written by the same writer as Red Dead Redemption, and it received Zero Punctuation’s Game of The Year in 2014.
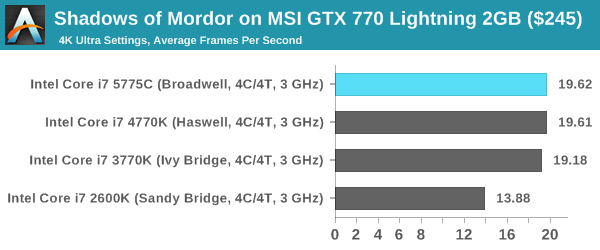
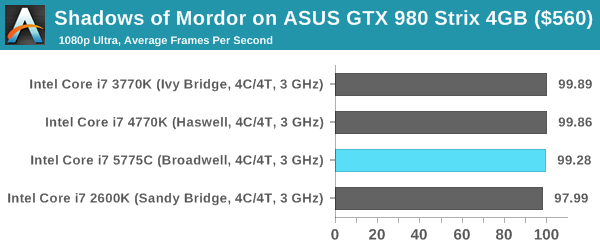
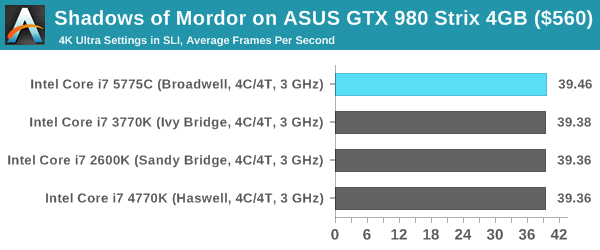
For testing purposes, SoM gives a dynamic screen resolution setting, allowing us to render at high resolutions that are then scaled down to the monitor. As a result, we get several tests using the in-game benchmark. For low end graphics we examine at 720p with low settings, whereas mid and high end graphics get 1080p Ultra. The top graphics test is also redone at 3840x2160, also with Ultra settings, and we also test two cards at 4K where possible.

Conclusions on Gaming
From the graphs, it should be clear what the results say. On the whole, we saw 0-5% improvement in the gaming frame rates for these titles compared to Sandy Bridge, although one could consider that the better the graphics card, the bigger the marginal gain:
- With an R7 240, GTA had a 3.6% gain going from i7-2600K to the i7-5775C.
- The GTX 770 gave some odd results with Mordor, but Attila had a 5.5% gain overall.
- On the GTX 980, Grand Theft Auto had a 13.2% gain from the i7-2600K, and Attila saw a 5.7% gain from Haswell to Broadwell.
At the end of the day, the gains in gaming will be down to specific titles. That being said, Grand Theft Auto has been a good example recently of how to write a game (if you have the budget), and if the DX12 methodology can come to involve the CPU more in draw call latency, we might see a bigger generational gain with DX12 titles in the future.


121 Comments
View All Comments
extide - Monday, August 3, 2015 - link
Actually, no the Author has it correct. The big die the che CPU/GPU, and the small one is the eDRAM.On the GT3 dies, Intel folds the graphics back across the CPU's, instead of having it as a very long rectangle.
See this: http://www.computershopper.com/var/ezwebin_site/st...
vs This: http://www.overclock.net/content/type/61/id/230657...
hansmuff - Monday, August 3, 2015 - link
Ian, Thank you for this excellent article. I have wished for a 2600k comparison to the more recent CPU iterations and one can piece some of it together here and there but this comprehensive view is outstanding! Still holding out for Skylake, then the 2600k might have to retire.Ewann - Monday, August 3, 2015 - link
I am really happy to see the i7-2600k comparison here. Like others who've commented, I'm still running that CPU- albeit at stock clock- and it's been totally stable with months on end of uptime (knock on wood). Sure, I've upgraded the GPU once or twice since 2011, but I can't see any reason to build a new system based on these benchmarks. The GPU (GTX 780) is still the limiting factor for gaming, and the 15-20% performance boost overall won't make a significant difference in my day-to-day usage. I now understand why Intel is struggling.Awesomeness - Monday, August 3, 2015 - link
Same here. I bought a 2600K in the first month it was out. After years of 24/7 operation at 4,9GHz it died. I replaced it with a $100 2500K that's running at 4,6GHz. SB for the win.nathanddrews - Monday, August 3, 2015 - link
OC benchmarks from each generation? I saw stock benchmarks and 3GHz benchmarks, but not benchmarks for Good or Great OC. I was expecting it based off of the title, but didn't see anything in the article.Staafk - Monday, August 3, 2015 - link
Missing OC performance comparisons. Or am I blind? The latter is quite possible tbh.Dribble - Monday, August 3, 2015 - link
Yes, that's what I thought. I want to see what they can all do at a good o/c. I don't run my cpu stock or at 3ghz, I want to see how my o/c sandy bridge would do against an o/c broadwell to see if it's worth an upgrade yet?Impulses - Monday, August 3, 2015 - link
You can typically extrapolate like 5% per 200MHz, tho it would've been nice to see indeed.joex4444 - Monday, August 3, 2015 - link
With the whole point of the article being that IPC goes up, this rule is really not suitable. If the IPC goes up by 20%, then if the previous generation followed the 5% per 200MHz rule the new generation follows either 6% per 200MHz or 5% per 167MHz. Though we'd really expect the instructions per second (IPS) to be the important part, and that's not dependent solely upon the size of the overclock, but the ratio of the overclock to stock. Jumping to 4.2GHz from 3.2GHz is a 31% gain, but going to 4.5GHz from 3.5GHz is a 29% gain despite both being a 1.0GHz overclock.With the typical IPC gain of 4.4%, we could roughly estimate that a Broadwell at 4.2GHz is like a Haswell at 4.4GHz. With 4.2GHz on Broadwell being a "Good OC" and 4.5GHz on Haswell being a "Good OC" we'd still expect Haswell to be faster once overclocked - but the review should be showing this. However if the particular program is making really good use of the eDRAM, then that 4.2GHz is akin to Haswell at 4.9GHz, which is beyond an excellent OC...
SirMaster - Monday, August 3, 2015 - link
Feelin' pretty good about my 4.6GHz 4770K that I bought more than 2 years ago heh.