The AMD A8-7650K APU Review, Also New Testing Methodology
by Ian Cutress on May 12, 2015 10:00 AM ESTGaming Benchmarks: Mid-Range
Alien: Isolation
If first person survival mixed with horror is your sort of thing, then Alien: Isolation, based off of the Alien franchise, should be an interesting title. Developed by The Creative Assembly and released in October 2014, Alien: Isolation has won numerous awards from Game Of The Year to several top 10s/25s and Best Horror titles, ratcheting up over a million sales by February 2015. Alien: Isolation uses a custom built engine which includes dynamic sound effects and should be fully multi-core enabled.
For low end graphics, we test at 720p with Ultra settings, whereas for mid and high range graphics we bump this up to 1080p, taking the average frame rate as our marker with a scripted version of the built-in benchmark.


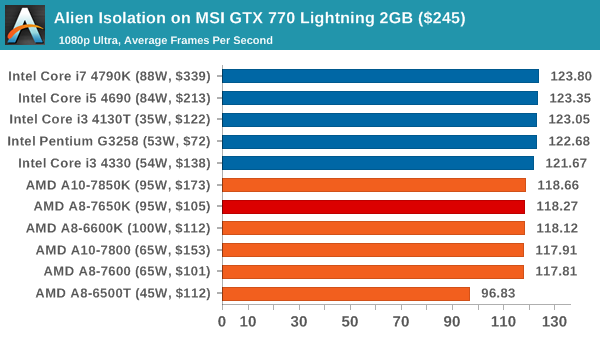
For mid range cards, Alien Isolation has a direct split for Intel and AMD, but the difference is a few FPS at best. It would seem that cores matter not here.
Total War: Attila
The Total War franchise moves on to Attila, another The Creative Assembly development, and is a stand-alone strategy title set in 395AD where the main story line lets the gamer take control of the leader of the Huns in order to conquer parts of the world. Graphically the game can render hundreds/thousands of units on screen at once, all with their individual actions and can put some of the big cards to task.
For low end graphics, we test at 720p with performance settings, recording the average frame rate. With mid and high range graphics, we test at 1080p with the quality setting. In both circumstances, unlimited video memory is enabled and the in-game scripted benchmark is used.

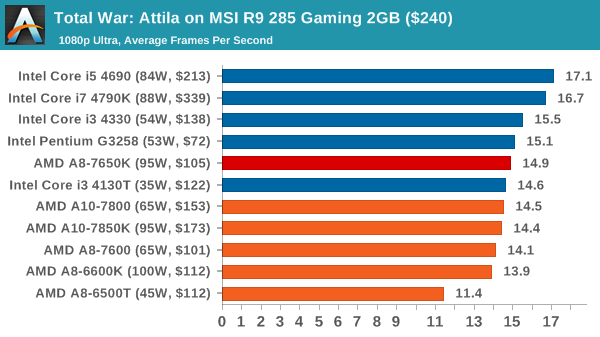
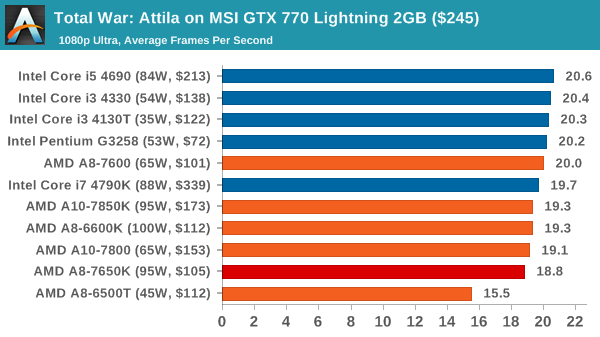
Neither combination here pulls Attila into a reasonable gaming rate, although there are bigger differences using the R9 285 GPU.
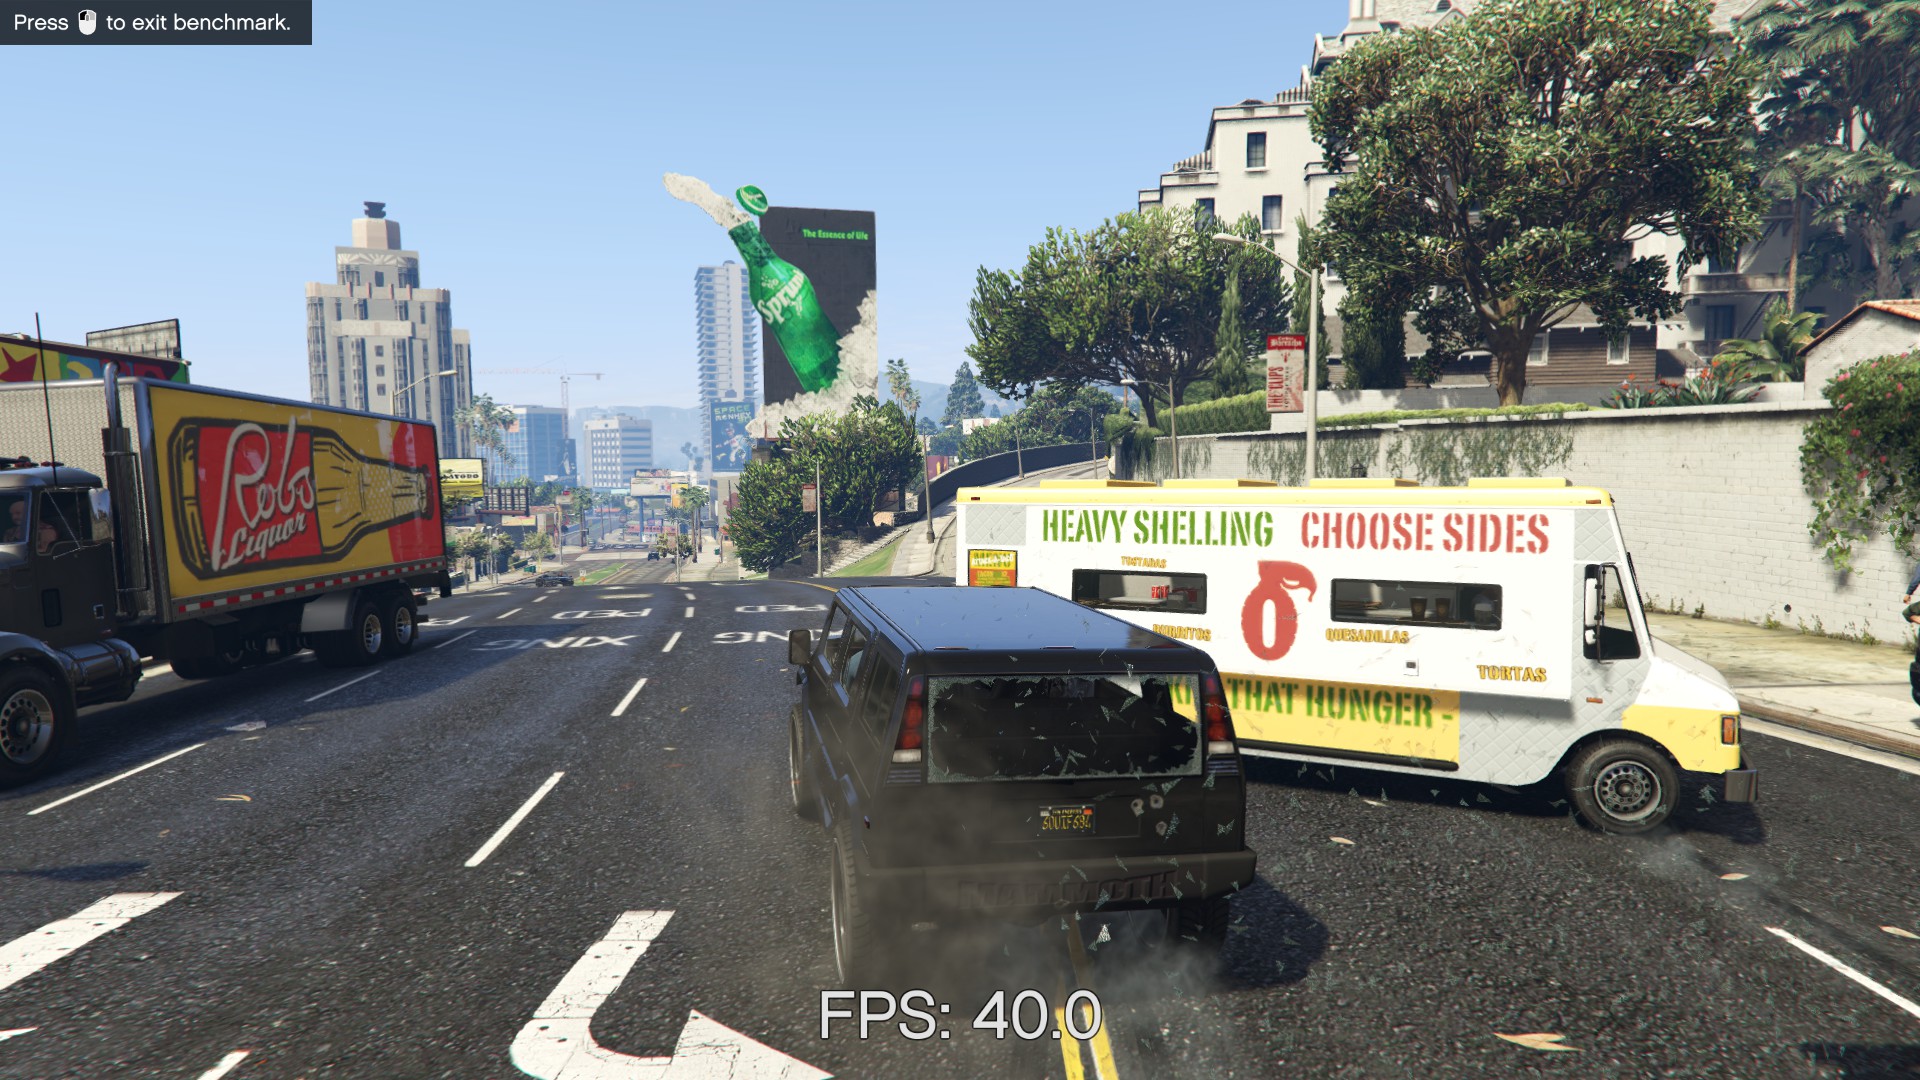
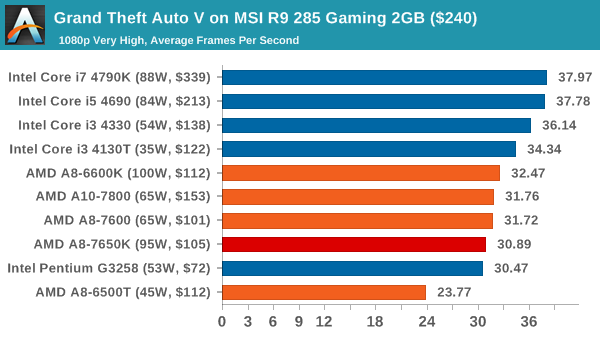
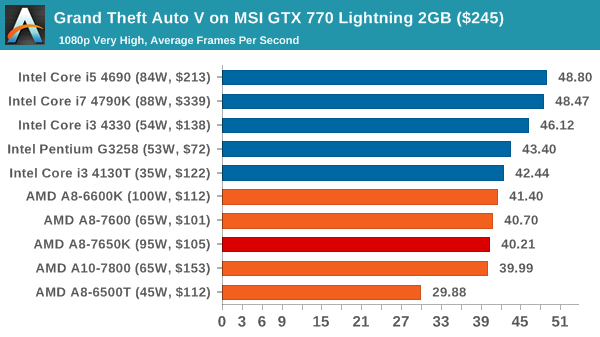
Grand Theft Auto V
The highly anticipated iteration of the Grand Theft Auto franchise finally hit the shelves on April 14th 2015, with both AMD and NVIDIA in tow to help optimize the title. GTA doesn’t provide graphical presets, but opens up the options to users and extends the boundaries by pushing even the hardest systems to the limit using Rockstar’s Advanced Game Engine. Whether the user is flying high in the mountains with long draw distances or dealing with assorted trash in the city, when cranked up to maximum it creates stunning visuals but hard work for both the CPU and the GPU.
For our test we have scripted a version of the in-game benchmark, relying only on the final part which combines a flight scene along with an in-city drive-by followed by a tanker explosion. For low end systems we test at 720p on the lowest settings, whereas mid and high end graphics play at 1080p with very high settings across the board. We record both the average frame rate and the percentage of frames under 60 FPS (16.6ms).
![Grand Theft Auto V on MSI R9 285 Gaming 2GB ($240) [Under 60 FPS]](https://images.anandtech.com/graphs/graph9217/74236.png)
![Grand Theft Auto V on MSI GTX 770 Lightning 2GB ($245) [Under 60 FPS]](https://images.anandtech.com/graphs/graph9217/74246.png)
On GTA, the G3258, the i3-4130T and the A8-7650K perform similarly, within a few frames of each other. Though in both circumstances the $200+ CPUs give the peak performance, up to 20% more than the $100 set.
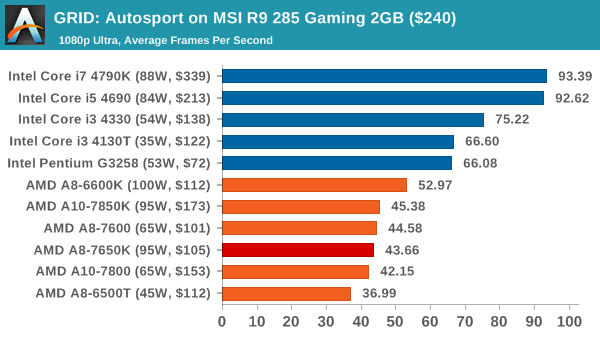
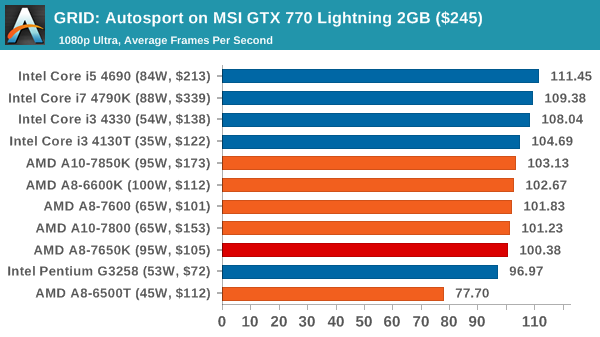
GRID: Autosport
No graphics tests are complete without some input from Codemasters and the EGO engine, which means for this round of testing we point towards GRID: Autosport, the next iteration in the GRID and racing genre. As with our previous racing testing, each update to the engine aims to add in effects, reflections, detail and realism, with Codemasters making ‘authenticity’ a main focal point for this version.
GRID’s benchmark mode is very flexible, and as a result we created a test race using a shortened version of the Red Bull Ring with twelve cars doing two laps. The car is focus starts last and is quite fast, but usually finishes second or third. For low end graphics we test at 1080p medium settings, whereas mid and high end graphics get the full 1080p maximum. Both the average and minimum frame rates are recorded.
![GRID: Autosport on MSI R9 285 Gaming 2GB ($240) [Minimum FPS]](https://images.anandtech.com/graphs/graph9217/74238.png)
![GRID: Autosport on MSI GTX 770 Lightning 2GB ($245) [Minimum FPS]](https://images.anandtech.com/graphs/graph9217/74248.png)
GRID on an R9 285 seems to love Intel and loves more cores, as shown by the jump from the i3 to the i5. Whereas on a GTX 770, both teams perform similarly, well north of 60 FPS, although the difference lies more in the minimum frame rates.
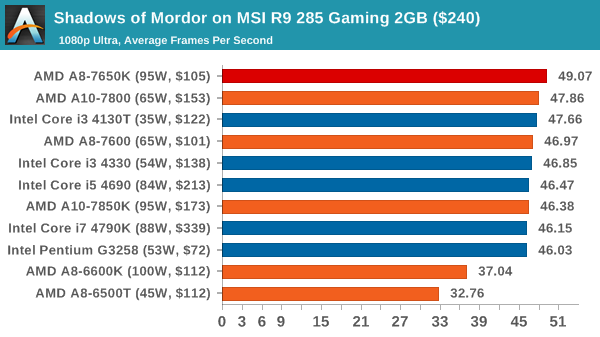
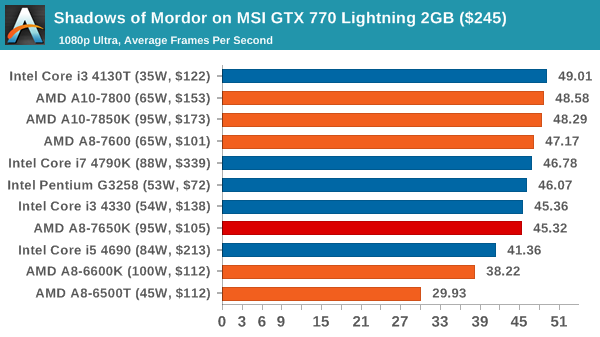
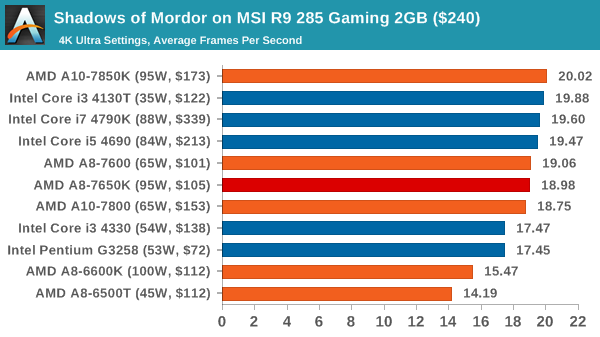
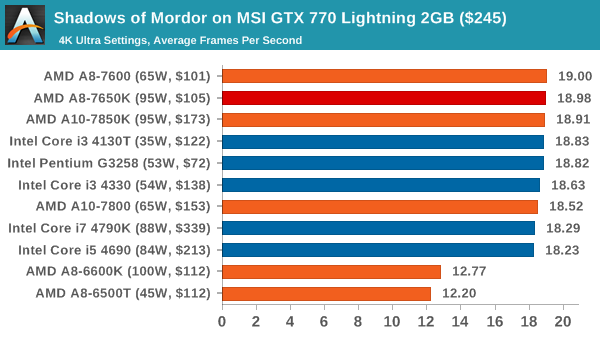
Middle-Earth: Shadows of Mordor
The final title in our testing is another battle of system performance with the open world action-adventure title, Shadows of Mordor. Produced by Monolith using the LithTech Jupiter EX engine and numerous detail add-ons, SoM goes for detail and complexity to a large extent, despite having to be cut down from the original plans. The main story itself was written by the same writer as Red Dead Redemption, and it received Zero Punctuation’s Game of The Year in 2014.
For testing purposes, SoM gives a dynamic screen resolution setting, allowing us to render at high resolutions that are then scaled down to the monitor. As a result, we get several tests using the in-game benchmark. For low end graphics we examine at 720p with low settings, whereas mid and high end graphics get 1080p Ultra. The top graphics test is also redone at 3840x2160, also with Ultra settings, and we also test two cards at 4K where possible.
![Shadows of Mordor on MSI R9 285 Gaming 2GB ($240) [Minimum FPS]](https://images.anandtech.com/graphs/graph9217/74240.png)
![Shadows of Mordor on MSI GTX 770 Lightning 2GB ($245) [Minimum FPS]](https://images.anandtech.com/graphs/graph9217/74250.png)
Interestingly the APUs so well at 1080p SoM, especially in average frame rates. Unfortunately this does not translate well in minimum frame rates.
Middle-Earth: Shadows of Mordor at 4K
![Shadows of Mordor on MSI GTX 770 Lightning 2GB ($245) [Minimum FPS]](https://images.anandtech.com/graphs/graph9217/74252.png)
At 4K, the older 6000 series APUs seem to be a little behind. With the R9 285 there is also a staggered affect in average FPS performance, although a clear definition in minimum frame rates.


177 Comments
View All Comments
Gigaplex - Tuesday, May 12, 2015 - link
What happened to the DX12 benchmarks? Do we need to remind you that DX12 hasn't even been released yet, so is completely unsuitable for comparing hardware?akamateau - Tuesday, May 12, 2015 - link
Porting a CURRENT game designed and CODED to DX11 MAX SPEC to DX12 does not mean that it will automatically look better or play better if you do not consider faster fps as the main criteria for quality game play. In fact DX11 Game benchmarks will not show ANY increase in performance using Mantle or DX12And logically, continuing to write to this DX11 MAXSPEC will NOT improve gaming community-wide in general. Let’s be clear, a higher spec game will cost more money. So the studio must balance cost and projected sales. So I would expect that incremental increases in game quality may occur over the next few years as studios become more confident with spending more of the gaming budget on a higher MINSPEC DX12 game. Hey, it is ALL ABOUT THE MONEY.
If a game was written with the limitations or, better, say the maximums or MAXSPEC of DX11 then that game will in all likelihood not look any better with DX12. You will run it at faster frame rates but if the polygons, texture details and AI objects aren't there then the game will only be as detailed as the original programming intent will allow.
However, what DX12 will give you is a game that is highly playable with much less expensive hardware.
For instance using 3dMark API Overhead test, it is revealed with DX11 Intel i7-4960 with a GTX 980 can produce 2,000,000 draw calls at 30fps. Switch to DX12 and it is revealed that a single $100 AMD A6-7400 APU can produce 4,400,000 draw calls and get 30 fps. Of course these aren't rendered but you can't render the object if hasn;t been drawn.
If you are happy with the level of performance that $1500 will get you with DX11 then you should be ecstatic to get very close to the same level of play that DX12and a $100 A6 AMD APU will get you!!!!
That was the whole point behind Mantle, er (cough, cough) DX12. Gaming is opened up to more folks without massive amounts of surplus CASH.
silverblue - Tuesday, May 12, 2015 - link
Yes, yes, I see your point about AMD's iGPUs benefitting a lot from DirectX 12/Mantle, however I don't think you needed so many posts to make it. Additionally, not benchmarking a specific way doesn't make somebody a liar, it just means they didn't benchmark a specific way.Draw calls don't necessarily mean better performance, and if you're memory or ROP limited to begin with... what's more, the performance difference between the 384-shader 7600 and the 512-shader 7850K is practically nothing. Based off this, why would I opt for the 7850K when the 7600 performs similarly for less power? The 7400K is only a little behind but is significantly slower in DX11 testing. Does that mean we don't need the 7600 either if we're playing DX12 titles? Has the test highlighted a significant memory bottleneck with the whole Kaveri product stack that DX12 simply cannot solve?
In addition, consider the dGPU results. Intel still smokes AMD on a per-FPU basis. By your own logic, AMD will not gain any ground on Intel at all in this area if we judge performance purely on draw calls.
DirectX 11 is still current. There aren't many Mantle games out there to provide much for this comparison, but I'm sure somebody will have those results on another site for you to make further comparisons.
akamateau - Tuesday, May 12, 2015 - link
There is ONLY ONE BENCHMARK that is relevant to gamers.3dMark API Overhead Test!
If I am considering a GPU purchase I am not buying it becasue I want to Calculate Pi to a BILLION decimal places. I want better gameplay.
When I am trying to decide on an AMD APU or Intel IGP then that decision is NOT based on CineBench but rather what siliocn produces QUALITY GAMEPLAY.
You are DELIBERATELY IGNORING DX12 API Overhead Tests and that makes you a liar.
The 3dMark API Overhead Test measures the draw calls that are produced when the FPS drops below 30. As the following numbers will show the AMD APU will give the BEST GAMING VISUAL EXPERIENCE.
So what happens when this benchmark is run on AMD APU’s and Intel IGP?
AMD A10-7700k
DX11 = 655,000 draw calls.
Mantle = 4,509,000 Draw calls.
DX11 = 4,470,000 draw calls.
AMD A10-7850K
DX11 = 655,000 draw calls
Mantle = 4,700,000 draw calls
DX12 = 4,454,000 draw calls.
AMD A8-7600
DX11 = 629,000 draw calls
Mantle = 4,448,000 draw calls.
DX12 = 4,443,000 draw calls.
AMD A6-7400k
DX11 = 513,000 draw calls
Mantle = 4,047,000 draw calls
DX12 = 4,104,000 draw calls
Intel Core i7-4790
DX11 = 696,000 draw calls.
DX12 = 2,033,000 draw calls
Intel Core i5-4690
DX11 = 671,000 draw calls
DX12 = 1,977,000 draw calls.
Intel Core i3-4360
DX11 = 640,000 draw calls.
DX12 = 1,874,000 draw calls
Intel Core i3-4130T
DX11 = 526,000 draw calls.
DX12 = 1,692,000 draw calls.
Intel Pentium G3258
DX11 = 515,000 draw calls.
DX12 = 1,415,000 draw calls.
These numbers were gathered from AnandTech piece written on March 27, 2015.
Intel IGP is hopelessly outclassed by AMD APU’s using DX12. AMD outperforms Intel by 100%!!!
JumpingJack - Wednesday, May 13, 2015 - link
"There is ONLY ONE BENCHMARK that is relevant to gamers.3dMark API Overhead Test!"
NO, that is a syntethic, it simply states how many draw call can be made. It does not measure the capability of the entire game engine.
There is only ONE benchmark of concern to gamers -- actual performance of the games they play. Period.
Get ready for a major AMD DX12 let down if this is your expectation.
akamateau - Tuesday, May 12, 2015 - link
Legacy Benchmarks?????? i am going to spend money based on OBSOLETE BENCHMARKS???CineBench 11.5 was released in 2010 and is obsolete. It is JUNK
TrueCrypt???? TreuCrypt development was ended in MAY 2014. Another piece of JUNK.
Where is 3dMark API Overhead Test? That is brand new.
Where Is STARSWARM?? That is brand new.
akamateau - Tuesday, May 12, 2015 - link
Where are your DX12 BENCHMARKS?akamateau - Tuesday, May 12, 2015 - link
Where are your DX12 BENCHMARKS?rocky12345 - Tuesday, May 12, 2015 - link
whining about no DX12 test just take the info that was given & learn from that and wait for a released DX12 program that can truely be tested. testing DX12 at this point has very little to offer because it is still a beta product & the code is far from finished & by the time it is done all the tests you are screaming to have done will not be worth a pinch of racoon crap.galta - Tuesday, May 12, 2015 - link
Back when DX11 was about be released, AMD fans said the same: nVidia is better @DX10, but with DX11, Radeons superior I-don't-know-what will rule.Time passed and nVidia smashed Radeons new - and rebranded - GPUs.
I suspect it will be the same this time.