Intel SSD 750 PCIe SSD Review: NVMe for the Client
by Kristian Vättö on April 2, 2015 12:00 PM ESTAnandTech Storage Bench - The Destroyer
The Destroyer has been an essential part of our SSD test suite for nearly two years now. It was crafted to provide a benchmark for very IO intensive workloads, which is where you most often notice the difference between drives. It's not necessarily the most relevant test to an average user, but for anyone with a heavier IO workload The Destroyer should do a good job at characterizing performance.
| AnandTech Storage Bench - The Destroyer | ||||||||||||
| Workload | Description | Applications Used | ||||||||||
| Photo Sync/Editing | Import images, edit, export | Adobe Photoshop CS6, Adobe Lightroom 4, Dropbox | ||||||||||
| Gaming | Download/install games, play games | Steam, Deus Ex, Skyrim, Starcraft 2, BioShock Infinite | ||||||||||
| Virtualization | Run/manage VM, use general apps inside VM | VirtualBox | ||||||||||
| General Productivity | Browse the web, manage local email, copy files, encrypt/decrypt files, backup system, download content, virus/malware scan | Chrome, IE10, Outlook, Windows 8, AxCrypt, uTorrent, AdAware | ||||||||||
| Video Playback | Copy and watch movies | Windows 8 | ||||||||||
| Application Development | Compile projects, check out code, download code samples | Visual Studio 2012 | ||||||||||
The table above describes the workloads of The Destroyer in a bit more detail. Most of the workloads are run independently in the trace, but obviously there are various operations (such as backups) in the background.
| AnandTech Storage Bench - The Destroyer - Specs | ||||||||||||
| Reads | 38.83 million | |||||||||||
| Writes | 10.98 million | |||||||||||
| Total IO Operations | 49.8 million | |||||||||||
| Total GB Read | 1583.02 GB | |||||||||||
| Total GB Written | 875.62 GB | |||||||||||
| Average Queue Depth | ~5.5 | |||||||||||
| Focus | Worst case multitasking, IO consistency | |||||||||||
The name Destroyer comes from the sheer fact that the trace contains nearly 50 million IO operations. That's enough IO operations to effectively put the drive into steady-state and give an idea of the performance in worst case multitasking scenarios. About 67% of the IOs are sequential in nature with the rest ranging from pseudo-random to fully random.
| AnandTech Storage Bench - The Destroyer - IO Breakdown | |||||||||||
| IO Size | <4KB | 4KB | 8KB | 16KB | 32KB | 64KB | 128KB | ||||
| % of Total | 6.0% | 26.2% | 3.1% | 2.4% | 1.7% | 38.4% | 18.0% | ||||
I've included a breakdown of the IOs in the table above, which accounts for 95.8% of total IOs in the trace. The leftover IO sizes are relatively rare in between sizes that don't have a significant (>1%) share on their own. Over a half of the transfers are large IOs with one fourth being 4KB in size.
| AnandTech Storage Bench - The Destroyer - QD Breakdown | ||||||||||||
| Queue Depth | 1 | 2 | 3 | 4-5 | 6-10 | 11-20 | 21-32 | >32 | ||||
| % of Total | 50.0% | 21.9% | 4.1% | 5.7% | 8.8% | 6.0% | 2.1% | 1.4% | ||||
Despite the average queue depth of 5.5, a half of the IOs happen at queue depth of one and scenarios where the queue depths is higher than 10 are rather infrequent.
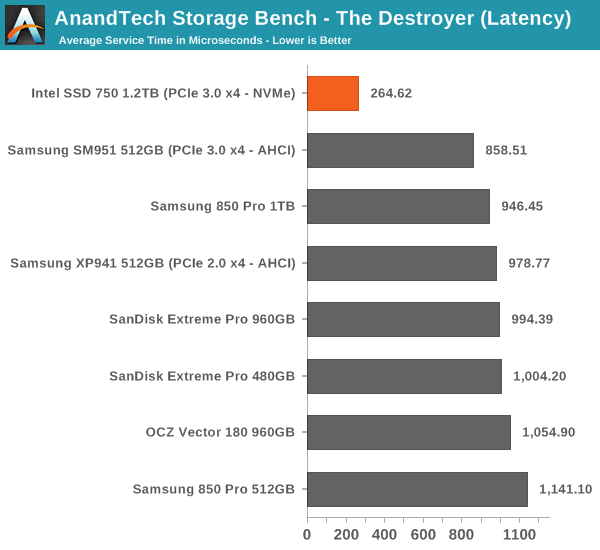
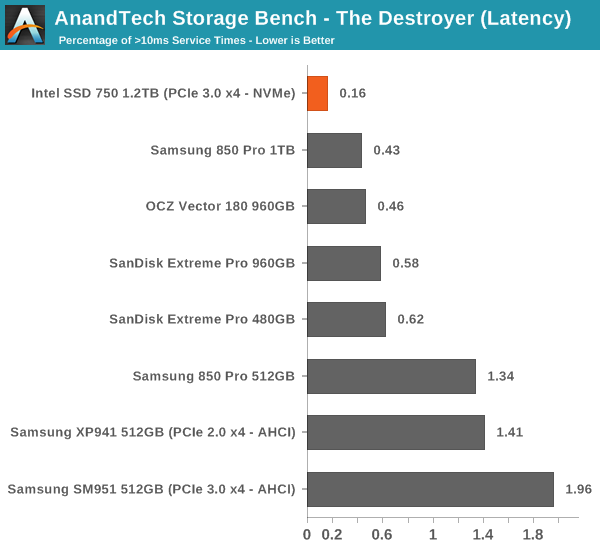
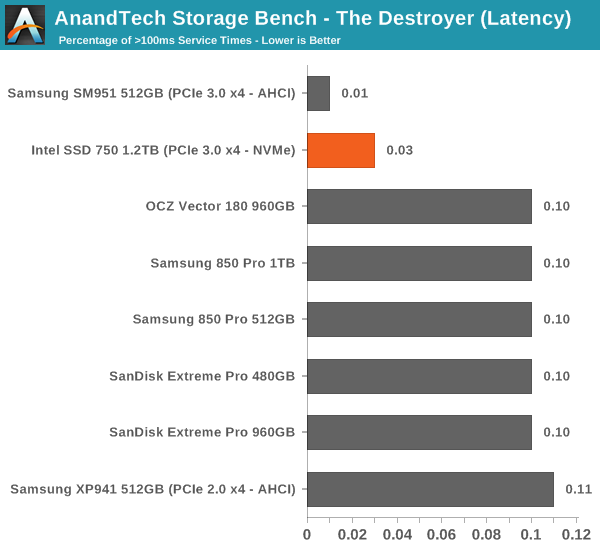
The two key metrics I'm reporting haven't changed and I'll continue to report both data rate and latency because the two have slightly different focuses. Data rate measures the speed of the data transfer, so it emphasizes large IOs that simply account for a much larger share when looking at the total amount of data. Latency, on the other hand, ignores the IO size, so all IOs are given the same weight in the calculation. Both metrics are useful, although in terms of system responsiveness I think the latency is more critical. As a result, I'm also reporting two new stats that provide us a very good insight to high latency IOs by reporting the share of >10ms and >100ms IOs as a percentage of the total.
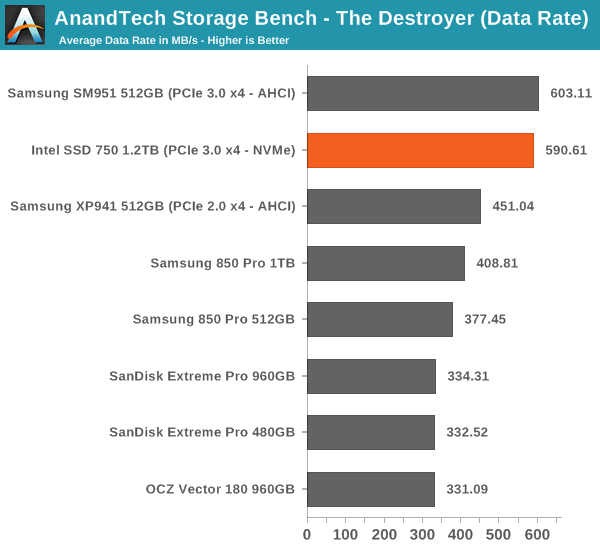
In terms of throughput, the SSD 750 is actually marginally slower than the SM951, although when you look at latency the SD 750 wins by a large margin. The difference in these scores is explained by Intel's focus on random performance as Intel specifically optimized the firmware for high random IO performance, which does have some impact on the sequential performance. As I've explained above, data rate has more emphasis on large IO size transfers, whereas latency treats all IOs the same regardless of their size.
The number of high latency IOs is also excellent and in fact the best we have tested. The SSD 750 is without a doubt a very consistent drive.


132 Comments
View All Comments
knweiss - Thursday, April 2, 2015 - link
According to Semiaccurate the 400 GB drive has "only" 512 MB DRAM.(Unfortunately, ARK hasn't been updated yet so I can't verify.)
eddieobscurant - Thursday, April 2, 2015 - link
You're right it's probably 512mb for the 400gb model and 1gb for the 1.2tb modelAzunia - Thursday, April 2, 2015 - link
In PCPer's review of this drive, they actually talk about the problems of benchmarking this drive. (https://www.youtube.com/watch?v=ubxgTBqgXV8)Seems like some benchmarks like Iometer cannot actually feed the drive, due to being programmed with a single thread. Have you had similar experiences during benchmarking, or is their logic faulty?
Kristian Vättö - Friday, April 3, 2015 - link
I didn't notice anything that would suggest a problem with Iometer's capability of saturating the drive. In fact, Intel provided us Iometer benchmarking guidelines for the review, although they didn't really differ from what I've been doing for a while now.Azunia - Friday, April 3, 2015 - link
Reread their article and it seems like the only problem is the Iometer's Fileserver IOPS Test, which peaks at around 200.000 IOPS, since you don't use that one thats probably the reason why you saw no problem.Gigaplex - Thursday, April 2, 2015 - link
"so if you were to put two SSD 750s in RAID 0 the only option would be to use software RAID. That in turn will render the volume unbootable"It's incredibly easy to use software RAID in Linux on the boot drives. Not all software RAID implementations are as limiting as Windows.
PubFiction - Friday, April 3, 2015 - link
"For better readability, I now provide bar graphs with the first one being an average IOPS of the last 400 seconds and the second graph displaying the standard deviation during the same period"lol why not just portray standard deviation as error bars like they are supposed to be shown. Kudos for being one of the few sites to recognize this but what a convoluted senseless way of showing them.
Chloiber - Friday, April 3, 2015 - link
I think the practical tests of many other reviews show that the normal consumer has absolutely no benefit (except being able to copy files faster) from such an SSD. We have reached the peak a long time ago. SSDs are not the limiting factor anymore.Still, it's great to see that we finally again major improvements. It was always sad that all SSDs got limited by the interface. This was the case with SATA 2, it's the case with SATA 3.
akdj - Friday, April 3, 2015 - link
Thanks for sharing KristianQuery about the thorough put using these on external Thunderbolt docks and PCIe 'decks' (several new third party drive and GPU enclosires experimenting with the latter ...and adding powerful desktop cards {GPU} etc) ... Would there still be the 'bottle neck' (not that SLI nor Crossfire with the exception of the MacPro and how the two AMDs work together--would be a concern in OS X but Windows motherboards...) if you were to utilize the TBolt headers to the PCIe lane-->CPU? These seem like a better idea than external video cards for what I'm Doing on the rMBPs. The GPUs are quick enough, especially in tandem with the IrisPro and its ability to 'calculate' ;) -- but a 2.4GB twin card RAID external box with a 'one cord' plug hot or cold would be SWEEET,
wyewye - Friday, April 3, 2015 - link
Kristian: test with QD128, moron, its NVM.Anandtech becomes more and more idiotic: poor articles and crappy hosting, you have to real pages multiple times to access anything.
Go look at TSSDreview for a competent review.