Intel SSD 750 PCIe SSD Review: NVMe for the Client
by Kristian Vättö on April 2, 2015 12:00 PM ESTRandom Read Performance
One of the major changes in our 2015 test suite is the synthetic Iometer tests we run. In the past we used to test just one or two queue depths, but real world workloads always contain a mix of different queue depths as shown by our Storage Bench traces. To get the full scope in performance, I'm now testing various queue depths starting from one and going all the way to up to 32. I'm not testing every single queue depth, but merely how the throughput scales with the queue depth. I'm using exponential scaling, meaning that the tested queue depths increase in powers of two (i.e. 1, 2, 4, 8...).
Read tests are conducted on a full drive because that is the only way to ensure that the results are valid (testing with an empty drive can substantially inflate the results and in reality the data you are reading is always valid rather than full of zeros). Each queue depth is tested for three minutes and there is no idle time between the tests.
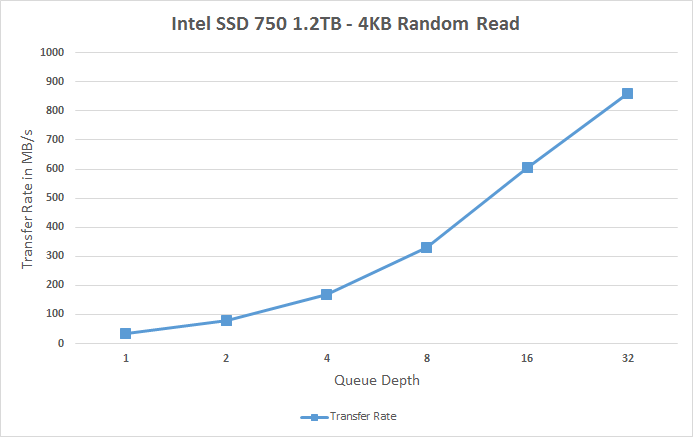
I'm also reporting two metrics now. For the bar graph, I've taken the average of QD1, QD2 and QD4 data rates, which are the most relevant queue depths for client workloads. This allows for easy and quick comparison between drives. In addition to the bar graph, I'm including a line graph, which shows the performance scaling across all queue depths. To keep the line graphs readable, each drive has its own graph, which can be selected from the drop-down menu.
I'm also plotting power for SATA drives and will be doing the same for PCIe drives as soon as I have the system set up properly. Our datalogging multimeter logs power consumption every second, so I report the average for every queue depth to see how the power scales with the queue depth and performance.
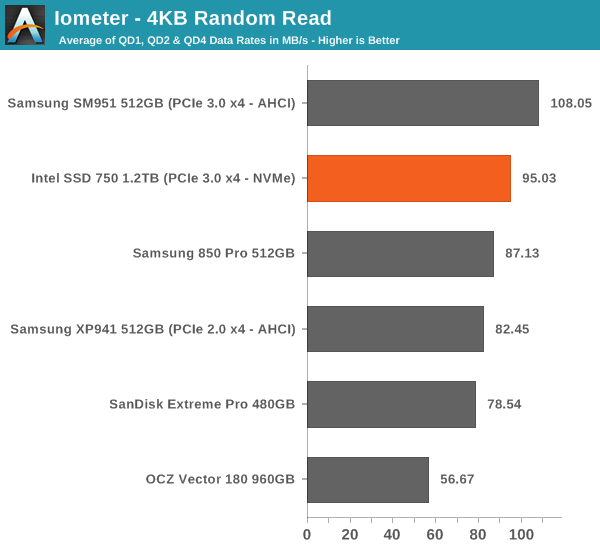
Despite having NVMe, the SSD 750 doesn't bring any improvements to low queue depth random read performance. Theoretically NVMe should be able to improve low QD random read performance because it adds less overhead compared to the AHCI software stack, but ultimately it's the NAND performance that's the bottleneck, although 3D NAND will improve that by a bit.
 |
|||||||||
The performance does scale nicely, though, and at queue depth of 32 the SSD 750 is able to hit over 200K IOPS. It's capable of delivering even more than that because unlike AHCI, NVMe can support more than 32 commands in the queue, but since client workloads rarely go above QD32 I see no point in test higher queue depths just for the sake of high numbers.
Random Write Performance
Write performance is tested in the same way as read performance, except that the drive is in a secure erased state and the LBA span is limited to 16GB. We already test performance consistency separately, so a secure erased drive and limited LBA span ensures that the results here represent peak performance rather than sustained performance.
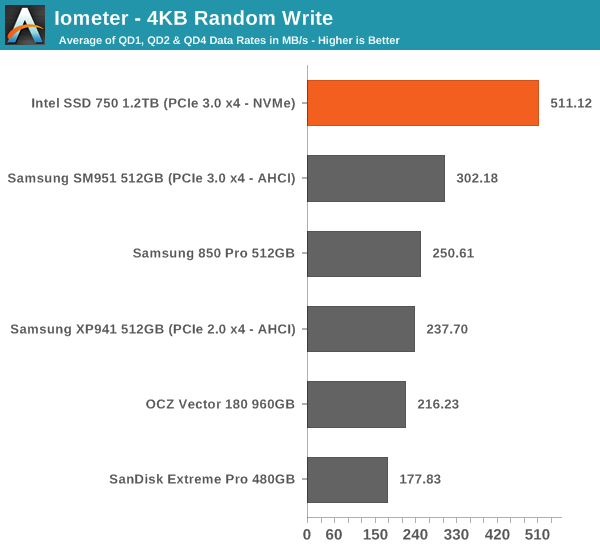
In random write performance the SSD 750 dominates the other drives. It seems Intel's random IO optimization really shows up here because the SM951 doesn't even come close. Obviously the lower latency of NVMe helps tremendously and since the SSD 750 features full power loss protection it can also cache more data in DRAM without the risk of data loss, which yields substantial performance gains.
 |
|||||||||
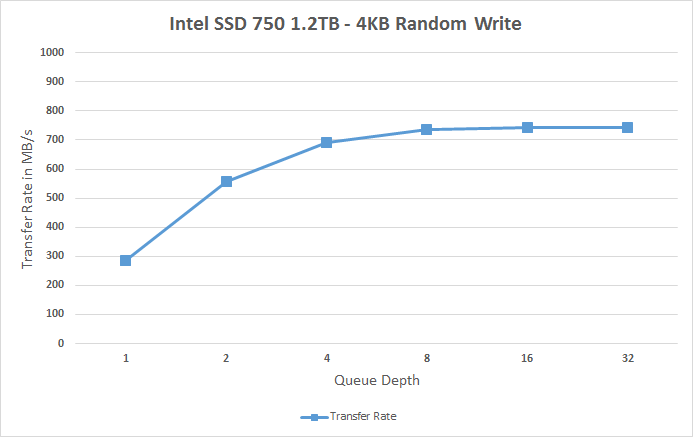
The SSD 750 also scales very efficiently and doesn't stop scaling until queue depth of 8. Note how big the difference is at queue depths of 1 and 2 -- for any random write centric workload the SSD 750 is an absolute killer.


132 Comments
View All Comments
knweiss - Thursday, April 2, 2015 - link
Kristian, you wrote "for up to 4GB/s of bandwidth with PCIe 3.0 (although in real world the maximum bandwidth is about 3.2GB/s due to PCIe inefficiency)". Is this really true? PCIe 2.0 uses 8b/10b encoding with 20% bandwidth overhead which would match your numbers. However, PCIe 3.0 uses 128b/130b encoding with only 1.54% bandwidth overhead. Could you please explain the inefficiency you mentioned? Thanks in advance!DanNeely - Thursday, April 2, 2015 - link
The real world number includes the bandwidth consumed by PCIe packet headers, NVME packet headers, NVME command messages, etc. Those are over and above the penalty from the encoding scheme on the bus itself.IntelUser2000 - Thursday, April 2, 2015 - link
The 4GB bandwidth takes into account the encoding scheme.Each lane of v1 PCI-Express had 2.5GT/s so with 8b/10b encoding you end up with 2.5G/10 = 250MB/s. Quadruple that for four lanes and you end up with 1GB/s.
v2 of PCI-Express is double that and v3 of PCI-Express is further double that and there is the 4GB number.
aggrokalle - Thursday, April 2, 2015 - link
i'm interrested in this as well...so how many nand-channels got the 1.2tb and 400gb version Kristian?tspacie - Thursday, April 2, 2015 - link
Was there an approximate release date?gforce007 - Thursday, April 2, 2015 - link
When will these be available for purchase? Also I have a m.2 slot on my motherboard (z10PE-D8 WS) Id rather utilize the 2.5 15mm form factor. I am a bit confused. I dont think that board has SFF-8639. Is there an adapter. Will that affect performance? I assume so and by how much?knweiss - Thursday, April 2, 2015 - link
The motherboard (host) end of the cable has a square-shaped SFF-8643(!) connector. E.g. ASUS ships an M.2 adapter card for the X99 Sabertooth that offers a suitable port. SFF-8639 is on the drive's end.emn13 - Thursday, April 2, 2015 - link
That endurance number is scarily low for a 1.2TB drive. 70GB a day for 5 years - thats about 128 TB of writes total, and that's just 100 drive writes! Put another way, at around 1GB/sec (which this drive can easily do), you'd reach those 100 drive writes in just 36 hours.Of course, that's an extremely intensive workload, but I sure hope this is just intel trying to avoid giving any warrantee rather than an every remotely realistic assessment of the drives capabilities.
p1esk - Thursday, April 2, 2015 - link
This is a consumer drive. What's your use case where you write more than 70GB a day?juhatus - Friday, April 3, 2015 - link
Raw 4k video and its not even close to being enough.At 4K (4096 x 2160) it registers 1697 Mbps which equals 764 GB/hour of 4K video footage. A single camera large Hollywood production can often shoot 100 hours of footage. That’s 76 TB of 4K ProRes 4444 XQ footage.
The upcoming David Fincher film GONE GIRL crept up on 500 hours of raw footage during its multi camera 6K RED Dragon production. That equates to roughly 315 TB of RED 6K (4:1) footage. Shit just got real for data management and post production workflows.