Intel SSD 750 PCIe SSD Review: NVMe for the Client
by Kristian Vättö on April 2, 2015 12:00 PM ESTRandom Read Performance
One of the major changes in our 2015 test suite is the synthetic Iometer tests we run. In the past we used to test just one or two queue depths, but real world workloads always contain a mix of different queue depths as shown by our Storage Bench traces. To get the full scope in performance, I'm now testing various queue depths starting from one and going all the way to up to 32. I'm not testing every single queue depth, but merely how the throughput scales with the queue depth. I'm using exponential scaling, meaning that the tested queue depths increase in powers of two (i.e. 1, 2, 4, 8...).
Read tests are conducted on a full drive because that is the only way to ensure that the results are valid (testing with an empty drive can substantially inflate the results and in reality the data you are reading is always valid rather than full of zeros). Each queue depth is tested for three minutes and there is no idle time between the tests.
I'm also reporting two metrics now. For the bar graph, I've taken the average of QD1, QD2 and QD4 data rates, which are the most relevant queue depths for client workloads. This allows for easy and quick comparison between drives. In addition to the bar graph, I'm including a line graph, which shows the performance scaling across all queue depths. To keep the line graphs readable, each drive has its own graph, which can be selected from the drop-down menu.
I'm also plotting power for SATA drives and will be doing the same for PCIe drives as soon as I have the system set up properly. Our datalogging multimeter logs power consumption every second, so I report the average for every queue depth to see how the power scales with the queue depth and performance.
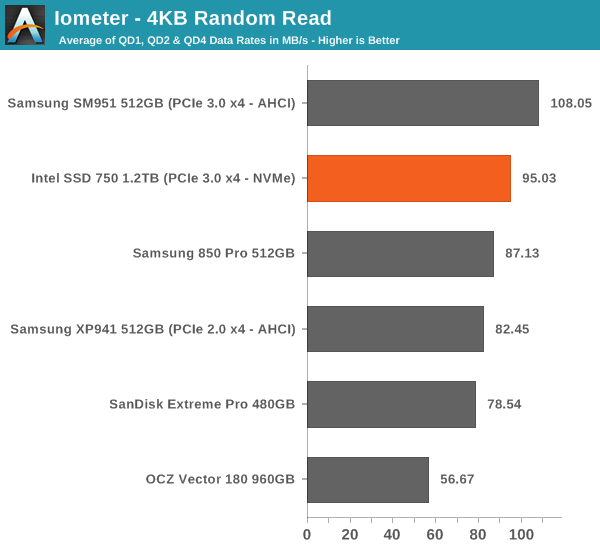
Despite having NVMe, the SSD 750 doesn't bring any improvements to low queue depth random read performance. Theoretically NVMe should be able to improve low QD random read performance because it adds less overhead compared to the AHCI software stack, but ultimately it's the NAND performance that's the bottleneck, although 3D NAND will improve that by a bit.
 |
|||||||||
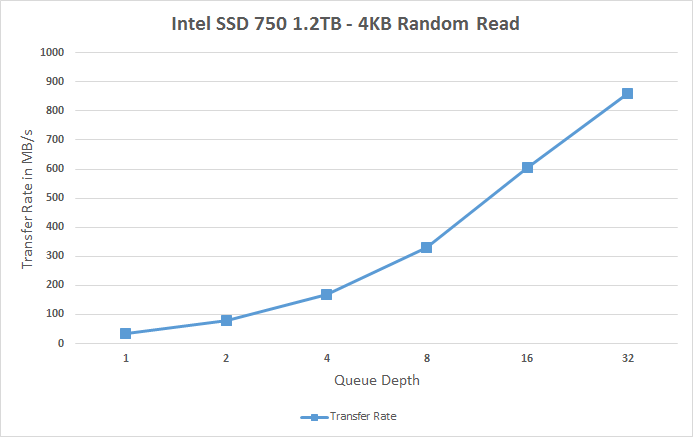
The performance does scale nicely, though, and at queue depth of 32 the SSD 750 is able to hit over 200K IOPS. It's capable of delivering even more than that because unlike AHCI, NVMe can support more than 32 commands in the queue, but since client workloads rarely go above QD32 I see no point in test higher queue depths just for the sake of high numbers.
Random Write Performance
Write performance is tested in the same way as read performance, except that the drive is in a secure erased state and the LBA span is limited to 16GB. We already test performance consistency separately, so a secure erased drive and limited LBA span ensures that the results here represent peak performance rather than sustained performance.
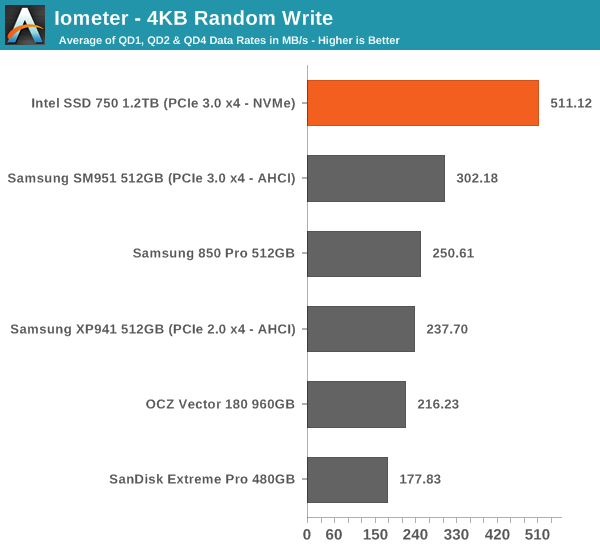
In random write performance the SSD 750 dominates the other drives. It seems Intel's random IO optimization really shows up here because the SM951 doesn't even come close. Obviously the lower latency of NVMe helps tremendously and since the SSD 750 features full power loss protection it can also cache more data in DRAM without the risk of data loss, which yields substantial performance gains.
 |
|||||||||
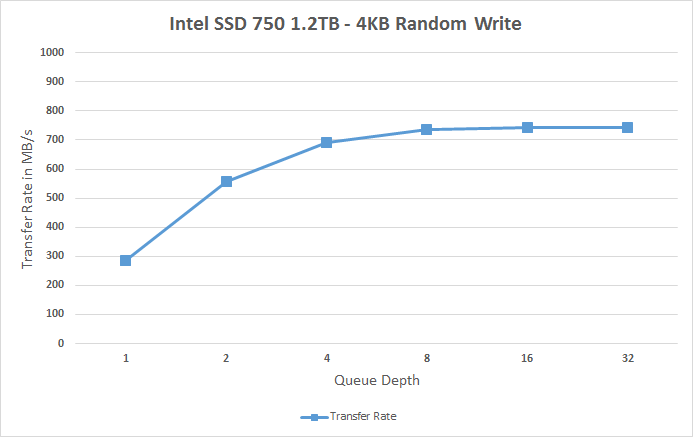
The SSD 750 also scales very efficiently and doesn't stop scaling until queue depth of 8. Note how big the difference is at queue depths of 1 and 2 -- for any random write centric workload the SSD 750 is an absolute killer.


132 Comments
View All Comments
KAlmquist - Thursday, April 2, 2015 - link
It's too bad that Anandtech didn't benchmark the 400 GB model, since that's the one most people are going to be most interested in buying. I assume that it's a case of Intel not making the 400 GB model available for review, rather than Anandtech deciding not to review it.jwilliams4200 - Thursday, April 2, 2015 - link
Agreed, the 400 GB model is more interesting to consumers.Also, I hope that if Anandtech does test the 400GB model, that they re-run the tests of the comparison SSDs so that the competitors are overprovisioned to 400GB usable capacity (from 512GB or whatever nominal capacity). That is the only reasonable way to compare, since anyone who wants high sustained performance and is willing to try a drive with only 400GB to achieve it would obviously be willing to overprovision, for example, a 512GB Samsung 850 Pro to only 400GB usable to achieve higher sustained performance.
Kristian Vättö - Thursday, April 2, 2015 - link
That is something that I've had on my mind for a while now and I even have a way to do it now (the Storage Bench traces are a bit tricky since they are run on a raw drive, but thankfully I found an hdparm command for limiting the far LBA count). The only issue is time because it takes roughly two days to test one drive through the 2015 suite, so I may be include a drive or two as comparison points but I definitely can't test all drives with added OP.Kristian Vättö - Thursday, April 2, 2015 - link
Not far LBA count, but raw LBA count, obviously :)Stahn Aileron - Friday, April 3, 2015 - link
Honestly, I'd rather have AnandTech test drives and components as-is ("stock" from the manufacturer) and publish those results rather than spend time doing tests on non-standard, customized configurations. Let the customers do that if they truly need that type of set-up or leave it to integrators/specialists.As far as I know, most customers of a product just want to use it immediately right of the box, no mucking with special settings. Most products are advertised that way as well.
Really, just test the product(s) as advertised/intended by the manufacturer first and foremost to see if it matches their claims and properly serves the target userbase. Specialty cases should only be done if that is actively advertised as a feature, there is truly high interest, something makes you curious, and/or you have the time.
jwilliams4200 - Friday, April 3, 2015 - link
If this were a review site for the totally clueless, then you might have a point. But anandtech has always catered to enthusiasts and those who either already know a lot about how computer equipment works, or who want to learn.The target audience for this site would certainly consider something as simple as overprovisioning an SSD if it could significantly increase performance and/or achieve similar performance at lower cost relative to another product. So it makes sense to test SSDs configured for similar capacity or performance rather than just "stock" configuration. Anyone can take an SSD and run a few benchmarks. It takes a site as good as anandtech to go more in-depth and consider how SSDs are actually likely to be used and then present useful tests to its readers.
Kristian Vättö - Thursday, April 2, 2015 - link
That is correct. I always ask for all capacities, but in this case Intel decided to sample all media with only 1.2TB samples. I've asked for a 400GB, though, and will review it as soon as I get it.Mr Alpha - Thursday, April 2, 2015 - link
Has anyone managed to find this mythological list of compatible motherboards?Kristian Vättö - Thursday, April 2, 2015 - link
I just asked Intel and will provide a link as soon as I get one. Looks like it's not up yet as they didn't have an answer right away.tstones - Thursday, April 2, 2015 - link
Older chipsets like z77 and z87 will support NVMe?