Intel SSD 750 PCIe SSD Review: NVMe for the Client
by Kristian Vättö on April 2, 2015 12:00 PM ESTAnandTech Storage Bench - Heavy
While The Destroyer focuses on sustained and worst-case performance by hammering the drive with nearly 1TB worth of writes, the Heavy trace provides a more typical enthusiast and power user workload. By writing less to the drive, the Heavy trace doesn't drive the SSD into steady-state and thus the trace gives us a good idea of peak performance combined with some basic garbage collection routines.
| AnandTech Storage Bench - Heavy | ||||||||||||
| Workload | Description | Applications Used | ||||||||||
| Photo Editing | Import images, edit, export | Adobe Photoshop | ||||||||||
| Gaming | Pllay games, load levels | Starcraft II, World of Warcraft | ||||||||||
| Content Creation | HTML editing | Dreamweaver | ||||||||||
| General Productivity | Browse the web, manage local email, document creation, application install, virus/malware scan | Chrome, IE10, Outlook, Windows 8, AxCrypt, uTorrent, AdAware | ||||||||||
| Application Development | Compile Chromium | Visual Studio 2008 | ||||||||||
The Heavy trace drops virtualization from the equation and goes a bit lighter on photo editing and gaming, making it more relevant to the majority of end-users.
| AnandTech Storage Bench - Heavy - Specs | ||||||||||||
| Reads | 2.17 million | |||||||||||
| Writes | 1.78 million | |||||||||||
| Total IO Operations | 3.99 million | |||||||||||
| Total GB Read | 48.63 GB | |||||||||||
| Total GB Written | 106.32 GB | |||||||||||
| Average Queue Depth | ~4.6 | |||||||||||
| Focus | Peak IO, basic GC routines | |||||||||||
The Heavy trace is actually more write-centric than The Destroyer is. A part of that is explained by the lack of virtualization because operating systems tend to be read-intensive, be that a local or virtual system. The total number of IOs is less than 10% of The Destroyer's IOs, so the Heavy trace is much easier for the drive and doesn't even overwrite the drive once.
| AnandTech Storage Bench - Heavy - IO Breakdown | |||||||||||
| IO Size | <4KB | 4KB | 8KB | 16KB | 32KB | 64KB | 128KB | ||||
| % of Total | 7.8% | 29.2% | 3.5% | 10.3% | 10.8% | 4.1% | 21.7% | ||||
The Heavy trace has more focus on 16KB and 32KB IO sizes, but more than half of the IOs are still either 4KB or 128KB. About 43% of the IOs are sequential with the rest being slightly more full random than pseudo-random.
| AnandTech Storage Bench - Heavy - QD Breakdown | ||||||||||||
| Queue Depth | 1 | 2 | 3 | 4-5 | 6-10 | 11-20 | 21-32 | >32 | ||||
| % of Total | 63.5% | 10.4% | 5.1% | 5.0% | 6.4% | 6.0% | 3.2% | 0.3% | ||||
In terms of queue depths the Heavy trace is even more focused on very low queue depths with three fourths happening at queue depth of one or two.
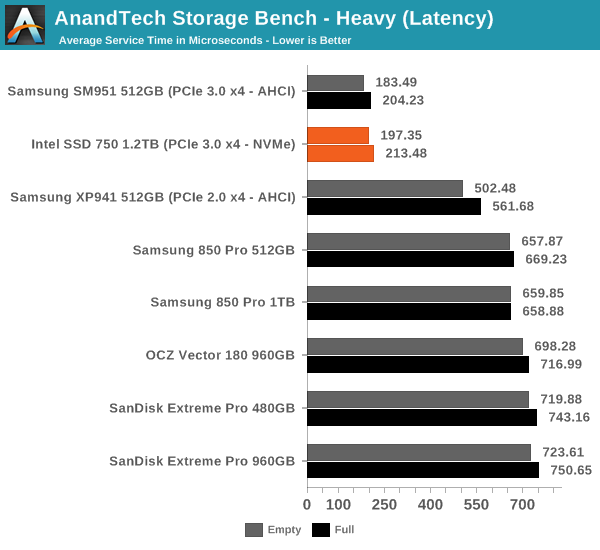
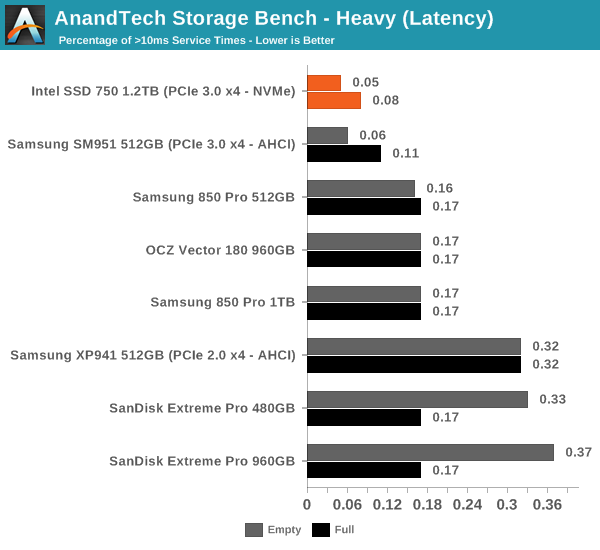
I'm reporting the same performance metrics as in The Destroyer benchmark, but I'm running the drive in both empty and full states. Some manufacturers tend to focus intensively on peak performance on an empty drive, but in reality the drive will always contain some data. Testing the drive in full state gives us valuable information whether the drive loses performance once it's filled with data.
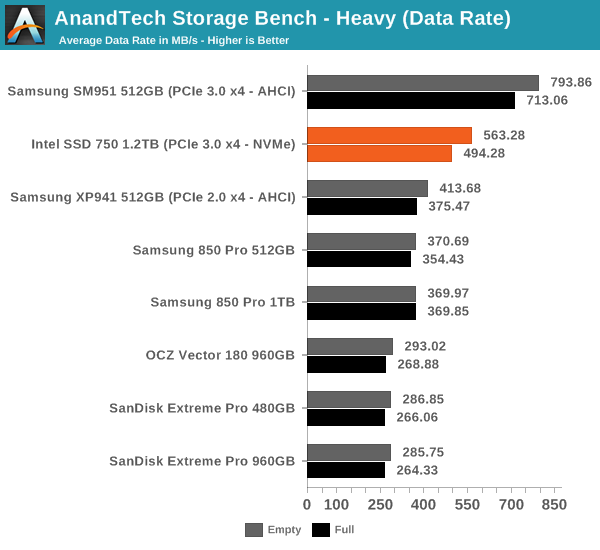
It turns out that the SM951 is overall faster than the SSD 750 in our heavy trace as it beats the SSD 750 in both data rate and average latency. I was expecting the SSD 750 to do better due to NVMe, but it looks like the SM951 is a very capable drive despite lacking NVMe (although there appears to be an NVMe version too after all). On the other hand, I'm not too surprised because the SM951 has specifically been built for client workloads, whereas the SSD 750 has an enterprise heritage and even on the client side it's designed for the most intensive workloads.


132 Comments
View All Comments
KAlmquist - Thursday, April 2, 2015 - link
It's too bad that Anandtech didn't benchmark the 400 GB model, since that's the one most people are going to be most interested in buying. I assume that it's a case of Intel not making the 400 GB model available for review, rather than Anandtech deciding not to review it.jwilliams4200 - Thursday, April 2, 2015 - link
Agreed, the 400 GB model is more interesting to consumers.Also, I hope that if Anandtech does test the 400GB model, that they re-run the tests of the comparison SSDs so that the competitors are overprovisioned to 400GB usable capacity (from 512GB or whatever nominal capacity). That is the only reasonable way to compare, since anyone who wants high sustained performance and is willing to try a drive with only 400GB to achieve it would obviously be willing to overprovision, for example, a 512GB Samsung 850 Pro to only 400GB usable to achieve higher sustained performance.
Kristian Vättö - Thursday, April 2, 2015 - link
That is something that I've had on my mind for a while now and I even have a way to do it now (the Storage Bench traces are a bit tricky since they are run on a raw drive, but thankfully I found an hdparm command for limiting the far LBA count). The only issue is time because it takes roughly two days to test one drive through the 2015 suite, so I may be include a drive or two as comparison points but I definitely can't test all drives with added OP.Kristian Vättö - Thursday, April 2, 2015 - link
Not far LBA count, but raw LBA count, obviously :)Stahn Aileron - Friday, April 3, 2015 - link
Honestly, I'd rather have AnandTech test drives and components as-is ("stock" from the manufacturer) and publish those results rather than spend time doing tests on non-standard, customized configurations. Let the customers do that if they truly need that type of set-up or leave it to integrators/specialists.As far as I know, most customers of a product just want to use it immediately right of the box, no mucking with special settings. Most products are advertised that way as well.
Really, just test the product(s) as advertised/intended by the manufacturer first and foremost to see if it matches their claims and properly serves the target userbase. Specialty cases should only be done if that is actively advertised as a feature, there is truly high interest, something makes you curious, and/or you have the time.
jwilliams4200 - Friday, April 3, 2015 - link
If this were a review site for the totally clueless, then you might have a point. But anandtech has always catered to enthusiasts and those who either already know a lot about how computer equipment works, or who want to learn.The target audience for this site would certainly consider something as simple as overprovisioning an SSD if it could significantly increase performance and/or achieve similar performance at lower cost relative to another product. So it makes sense to test SSDs configured for similar capacity or performance rather than just "stock" configuration. Anyone can take an SSD and run a few benchmarks. It takes a site as good as anandtech to go more in-depth and consider how SSDs are actually likely to be used and then present useful tests to its readers.
Kristian Vättö - Thursday, April 2, 2015 - link
That is correct. I always ask for all capacities, but in this case Intel decided to sample all media with only 1.2TB samples. I've asked for a 400GB, though, and will review it as soon as I get it.Mr Alpha - Thursday, April 2, 2015 - link
Has anyone managed to find this mythological list of compatible motherboards?Kristian Vättö - Thursday, April 2, 2015 - link
I just asked Intel and will provide a link as soon as I get one. Looks like it's not up yet as they didn't have an answer right away.tstones - Thursday, April 2, 2015 - link
Older chipsets like z77 and z87 will support NVMe?