Intel SSD 750 PCIe SSD Review: NVMe for the Client
by Kristian Vättö on April 2, 2015 12:00 PM ESTMixed Random Read/Write Performance
Mixed read/write tests are also a new addition to our test suite. In real world applications a significant portion of workloads are mixed, meaning that there are both read and write IOs. Our Storage Bench benchmarks already illustrate mixed workloads by being based on actual real world IO traces, but until now we haven't had a proper synthetic way to measure mixed performance.
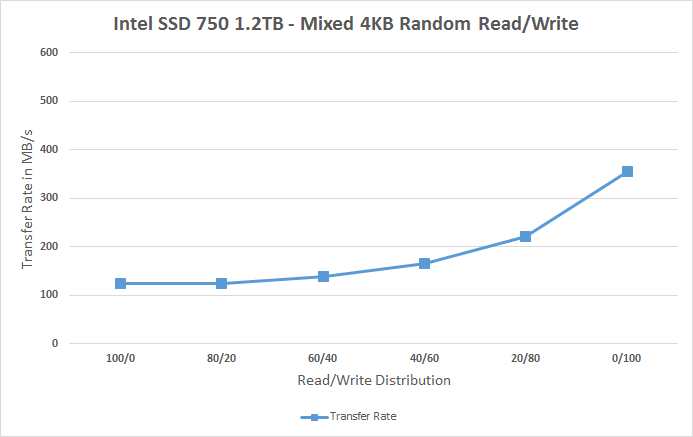
The benchmark is divided into two tests. The first one tests mixed performance with 4KB random IOs at six different read/write distributions starting at 100% reads and adding 20% of writes in each phase. Because we are dealing with a mixed workload that contains reads, the drive is first filled with 128KB sequential data to ensure valid results. Similarly, because the IO pattern is random, I've limited the LBA span to 16GB to ensure that the results aren't affected by IO consistency. The queue depth of the 4KB random test is three.
Again, for the sake of readability, I provide both an average based bar graph as well as a line graph with the full data on it. The bar graph represents an average of all six read/write distribution data rates for quick comparison, whereas the line graph includes a separate data point for each tested distribution.
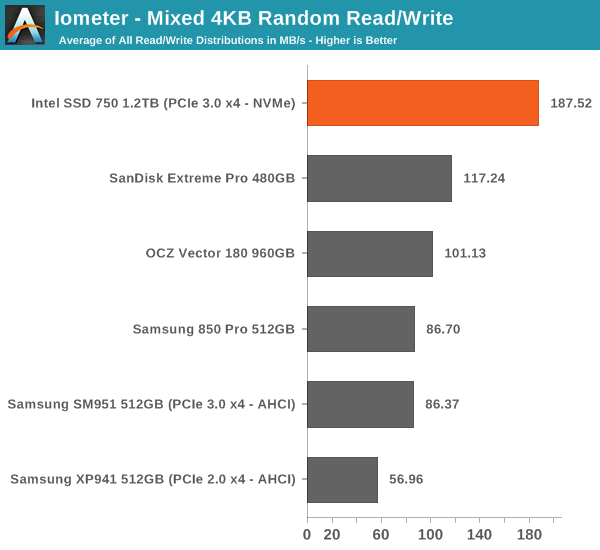
The SSD 750 does very well in mixed random workloads, especially when compared to the SM951 that is slower than most high-end SATA drives. The performance scales quite nicely as the portion of writes is increased.
 |
|||||||||
Mixed Sequential Read/Write Performance
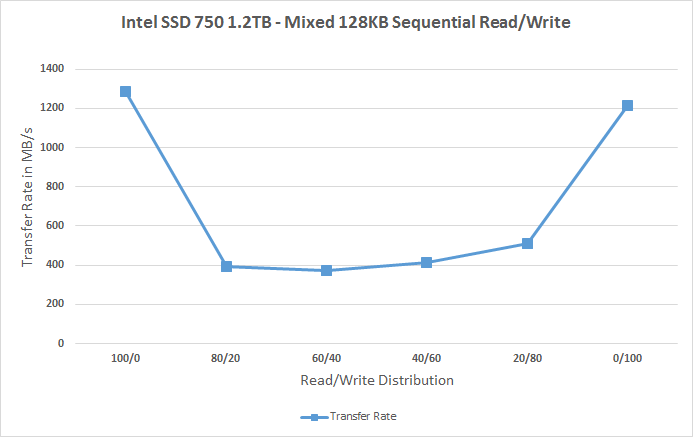
The sequential mixed workload tests are also tested with a full drive, but I've not limited the LBA range as that's not needed with sequential data patterns. The queue depth for the tests is one.
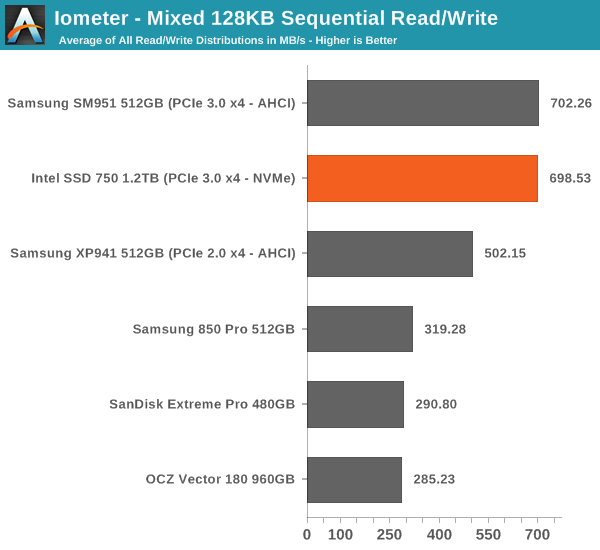
In mixed sequential workloads, however, the SSD 750 and SM951 are practically indentical. Both deliver excellent performance at 100% reads and writes, but the performance does drop significantly once reads and writes are mixed. Even with the drop, the two push out 400MB/s whereas most SATA drives manage ~200MB/s, so PCIe certainly has a big advantage here.
 |
|||||||||


132 Comments
View All Comments
Ethos Evoss - Saturday, April 4, 2015 - link
http://www.thessdreview.com/our-reviews/plextor-m6...Brazos - Monday, April 6, 2015 - link
Does the Plextor use NVMe?Sushisamurai - Saturday, April 4, 2015 - link
I mentioned this on twitter with you already, but Dead Rising 3 on a HDD versus a NVMe SSD comparison would be nice :) would save me the work of doing it and testing it on my own :pAntonAM - Monday, April 6, 2015 - link
I don't understand why both drives have the same endurance if one of them have 3 times more flash? Is it endurance of something else?emn13 - Monday, April 6, 2015 - link
The endurance figure is also *really* low compared to other drives - it works out to around 128TB of total writes - that's on the order of 50 times less than an 850Pro (which is slightly smaller).I'm hoping this is just a really stingy guarrantee, and not representative of the actual drive - otherwise I'd really, recommend against using it.
I mean, running the anandtech destroyer benchmark with its close to 1TB of writes would use up your write-allowance for the next two weeks (put another way, it's cost around 10$ in relation to the 1k drive cost).
edved - Tuesday, April 7, 2015 - link
So how does this compare to the Kingstone HyperX Predator that was recently reviewed and I recently purchased?!eliz82 - Tuesday, April 7, 2015 - link
any chance of testing Kingston HyperX Predator PCIe SSD ?SanX - Tuesday, April 7, 2015 - link
Put down the drain all flash trash and start making full power loss protected ramdrives with flash/harddrive backup. Would be cheap by this time if not slow selfdedtroying flash garbage lying on the way.gospadin - Tuesday, April 7, 2015 - link
In other words, 100x the cost for a marginal improvement in performance?Rustang - Wednesday, April 8, 2015 - link
1) Why would you post a review of a Intel SSD 750 PCIe SSD solution without benchmarking it against the other state of the art Intel PCIe SSD Intel DC P3700 solution?2) Why would you put up sequential/random read/write graphs with pull-downs to display the different hardware results instead of efficiently putting all of the hardware results on ONE graph?