Intel SSD 750 PCIe SSD Review: NVMe for the Client
by Kristian Vättö on April 2, 2015 12:00 PM ESTRandom Read Performance
One of the major changes in our 2015 test suite is the synthetic Iometer tests we run. In the past we used to test just one or two queue depths, but real world workloads always contain a mix of different queue depths as shown by our Storage Bench traces. To get the full scope in performance, I'm now testing various queue depths starting from one and going all the way to up to 32. I'm not testing every single queue depth, but merely how the throughput scales with the queue depth. I'm using exponential scaling, meaning that the tested queue depths increase in powers of two (i.e. 1, 2, 4, 8...).
Read tests are conducted on a full drive because that is the only way to ensure that the results are valid (testing with an empty drive can substantially inflate the results and in reality the data you are reading is always valid rather than full of zeros). Each queue depth is tested for three minutes and there is no idle time between the tests.
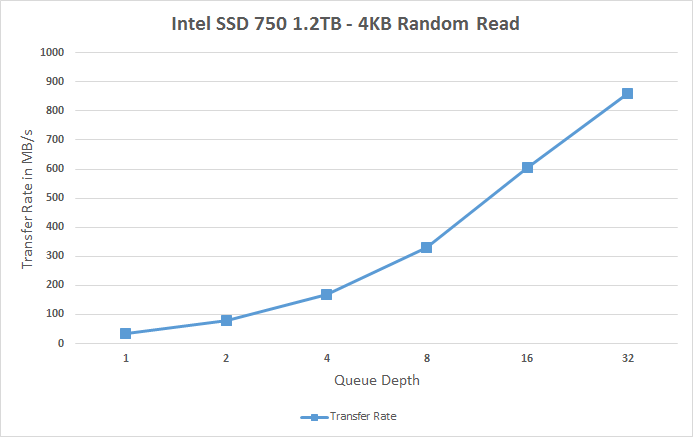
I'm also reporting two metrics now. For the bar graph, I've taken the average of QD1, QD2 and QD4 data rates, which are the most relevant queue depths for client workloads. This allows for easy and quick comparison between drives. In addition to the bar graph, I'm including a line graph, which shows the performance scaling across all queue depths. To keep the line graphs readable, each drive has its own graph, which can be selected from the drop-down menu.
I'm also plotting power for SATA drives and will be doing the same for PCIe drives as soon as I have the system set up properly. Our datalogging multimeter logs power consumption every second, so I report the average for every queue depth to see how the power scales with the queue depth and performance.
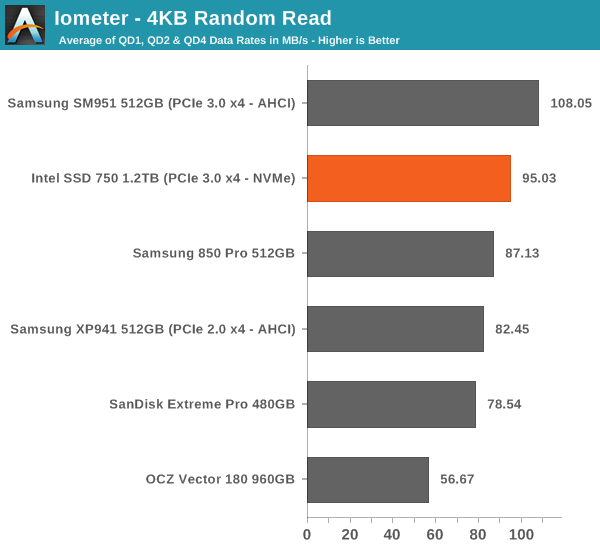
Despite having NVMe, the SSD 750 doesn't bring any improvements to low queue depth random read performance. Theoretically NVMe should be able to improve low QD random read performance because it adds less overhead compared to the AHCI software stack, but ultimately it's the NAND performance that's the bottleneck, although 3D NAND will improve that by a bit.
 |
|||||||||
The performance does scale nicely, though, and at queue depth of 32 the SSD 750 is able to hit over 200K IOPS. It's capable of delivering even more than that because unlike AHCI, NVMe can support more than 32 commands in the queue, but since client workloads rarely go above QD32 I see no point in test higher queue depths just for the sake of high numbers.
Random Write Performance
Write performance is tested in the same way as read performance, except that the drive is in a secure erased state and the LBA span is limited to 16GB. We already test performance consistency separately, so a secure erased drive and limited LBA span ensures that the results here represent peak performance rather than sustained performance.
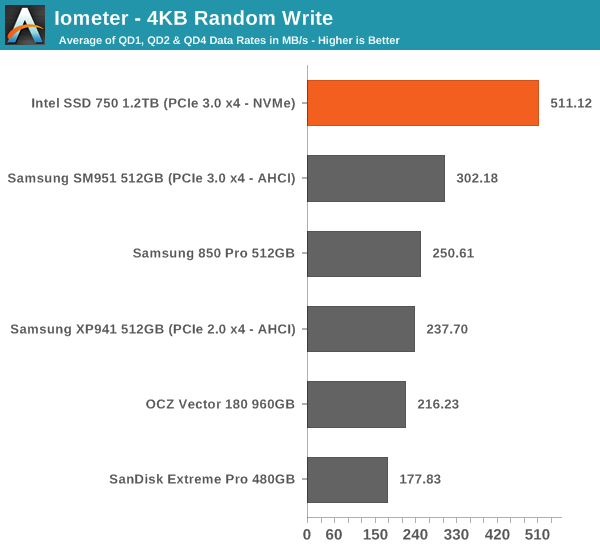
In random write performance the SSD 750 dominates the other drives. It seems Intel's random IO optimization really shows up here because the SM951 doesn't even come close. Obviously the lower latency of NVMe helps tremendously and since the SSD 750 features full power loss protection it can also cache more data in DRAM without the risk of data loss, which yields substantial performance gains.
 |
|||||||||
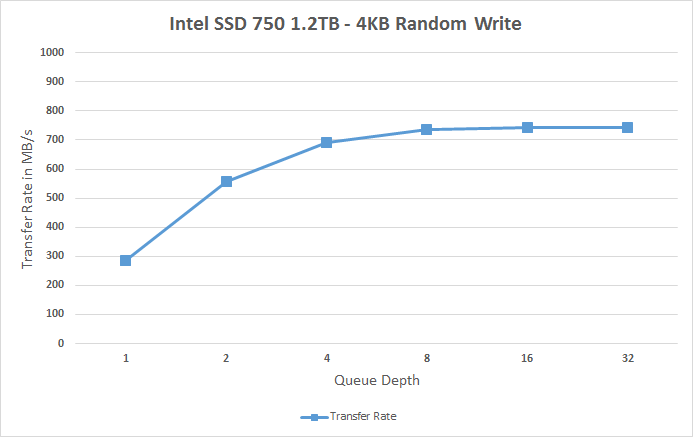
The SSD 750 also scales very efficiently and doesn't stop scaling until queue depth of 8. Note how big the difference is at queue depths of 1 and 2 -- for any random write centric workload the SSD 750 is an absolute killer.


132 Comments
View All Comments
Ethos Evoss - Saturday, April 4, 2015 - link
http://www.thessdreview.com/our-reviews/plextor-m6...Brazos - Monday, April 6, 2015 - link
Does the Plextor use NVMe?Sushisamurai - Saturday, April 4, 2015 - link
I mentioned this on twitter with you already, but Dead Rising 3 on a HDD versus a NVMe SSD comparison would be nice :) would save me the work of doing it and testing it on my own :pAntonAM - Monday, April 6, 2015 - link
I don't understand why both drives have the same endurance if one of them have 3 times more flash? Is it endurance of something else?emn13 - Monday, April 6, 2015 - link
The endurance figure is also *really* low compared to other drives - it works out to around 128TB of total writes - that's on the order of 50 times less than an 850Pro (which is slightly smaller).I'm hoping this is just a really stingy guarrantee, and not representative of the actual drive - otherwise I'd really, recommend against using it.
I mean, running the anandtech destroyer benchmark with its close to 1TB of writes would use up your write-allowance for the next two weeks (put another way, it's cost around 10$ in relation to the 1k drive cost).
edved - Tuesday, April 7, 2015 - link
So how does this compare to the Kingstone HyperX Predator that was recently reviewed and I recently purchased?!eliz82 - Tuesday, April 7, 2015 - link
any chance of testing Kingston HyperX Predator PCIe SSD ?SanX - Tuesday, April 7, 2015 - link
Put down the drain all flash trash and start making full power loss protected ramdrives with flash/harddrive backup. Would be cheap by this time if not slow selfdedtroying flash garbage lying on the way.gospadin - Tuesday, April 7, 2015 - link
In other words, 100x the cost for a marginal improvement in performance?Rustang - Wednesday, April 8, 2015 - link
1) Why would you post a review of a Intel SSD 750 PCIe SSD solution without benchmarking it against the other state of the art Intel PCIe SSD Intel DC P3700 solution?2) Why would you put up sequential/random read/write graphs with pull-downs to display the different hardware results instead of efficiently putting all of the hardware results on ONE graph?