Intel SSD 750 PCIe SSD Review: NVMe for the Client
by Kristian Vättö on April 2, 2015 12:00 PM ESTAnandTech Storage Bench - The Destroyer
The Destroyer has been an essential part of our SSD test suite for nearly two years now. It was crafted to provide a benchmark for very IO intensive workloads, which is where you most often notice the difference between drives. It's not necessarily the most relevant test to an average user, but for anyone with a heavier IO workload The Destroyer should do a good job at characterizing performance.
| AnandTech Storage Bench - The Destroyer | ||||||||||||
| Workload | Description | Applications Used | ||||||||||
| Photo Sync/Editing | Import images, edit, export | Adobe Photoshop CS6, Adobe Lightroom 4, Dropbox | ||||||||||
| Gaming | Download/install games, play games | Steam, Deus Ex, Skyrim, Starcraft 2, BioShock Infinite | ||||||||||
| Virtualization | Run/manage VM, use general apps inside VM | VirtualBox | ||||||||||
| General Productivity | Browse the web, manage local email, copy files, encrypt/decrypt files, backup system, download content, virus/malware scan | Chrome, IE10, Outlook, Windows 8, AxCrypt, uTorrent, AdAware | ||||||||||
| Video Playback | Copy and watch movies | Windows 8 | ||||||||||
| Application Development | Compile projects, check out code, download code samples | Visual Studio 2012 | ||||||||||
The table above describes the workloads of The Destroyer in a bit more detail. Most of the workloads are run independently in the trace, but obviously there are various operations (such as backups) in the background.
| AnandTech Storage Bench - The Destroyer - Specs | ||||||||||||
| Reads | 38.83 million | |||||||||||
| Writes | 10.98 million | |||||||||||
| Total IO Operations | 49.8 million | |||||||||||
| Total GB Read | 1583.02 GB | |||||||||||
| Total GB Written | 875.62 GB | |||||||||||
| Average Queue Depth | ~5.5 | |||||||||||
| Focus | Worst case multitasking, IO consistency | |||||||||||
The name Destroyer comes from the sheer fact that the trace contains nearly 50 million IO operations. That's enough IO operations to effectively put the drive into steady-state and give an idea of the performance in worst case multitasking scenarios. About 67% of the IOs are sequential in nature with the rest ranging from pseudo-random to fully random.
| AnandTech Storage Bench - The Destroyer - IO Breakdown | |||||||||||
| IO Size | <4KB | 4KB | 8KB | 16KB | 32KB | 64KB | 128KB | ||||
| % of Total | 6.0% | 26.2% | 3.1% | 2.4% | 1.7% | 38.4% | 18.0% | ||||
I've included a breakdown of the IOs in the table above, which accounts for 95.8% of total IOs in the trace. The leftover IO sizes are relatively rare in between sizes that don't have a significant (>1%) share on their own. Over a half of the transfers are large IOs with one fourth being 4KB in size.
| AnandTech Storage Bench - The Destroyer - QD Breakdown | ||||||||||||
| Queue Depth | 1 | 2 | 3 | 4-5 | 6-10 | 11-20 | 21-32 | >32 | ||||
| % of Total | 50.0% | 21.9% | 4.1% | 5.7% | 8.8% | 6.0% | 2.1% | 1.4% | ||||
Despite the average queue depth of 5.5, a half of the IOs happen at queue depth of one and scenarios where the queue depths is higher than 10 are rather infrequent.
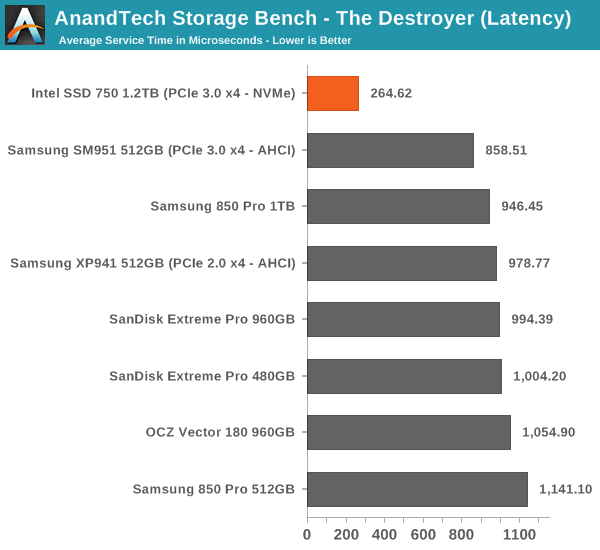
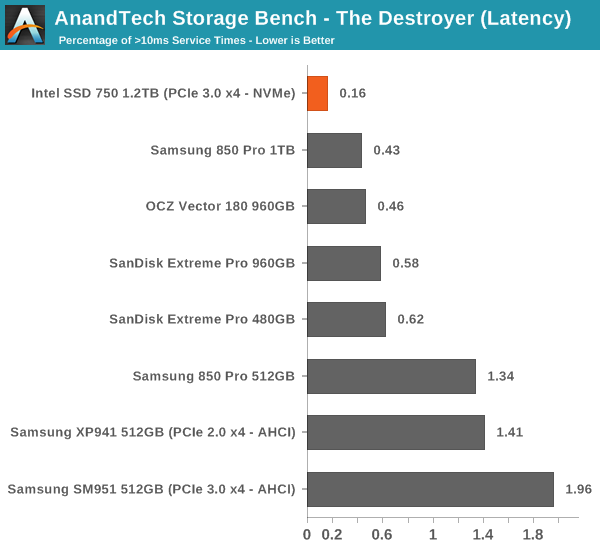
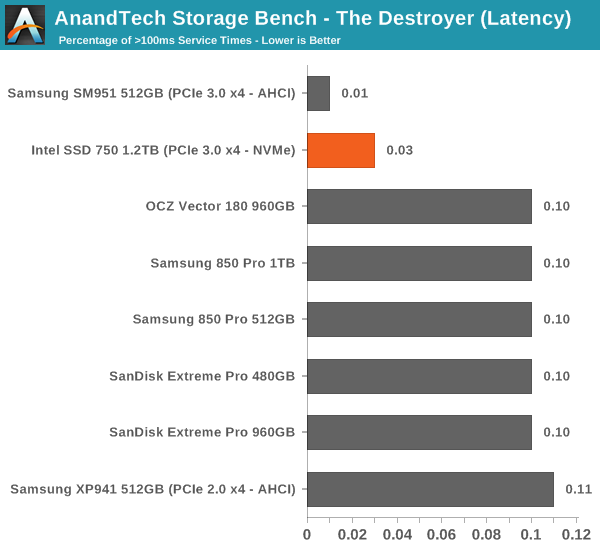
The two key metrics I'm reporting haven't changed and I'll continue to report both data rate and latency because the two have slightly different focuses. Data rate measures the speed of the data transfer, so it emphasizes large IOs that simply account for a much larger share when looking at the total amount of data. Latency, on the other hand, ignores the IO size, so all IOs are given the same weight in the calculation. Both metrics are useful, although in terms of system responsiveness I think the latency is more critical. As a result, I'm also reporting two new stats that provide us a very good insight to high latency IOs by reporting the share of >10ms and >100ms IOs as a percentage of the total.
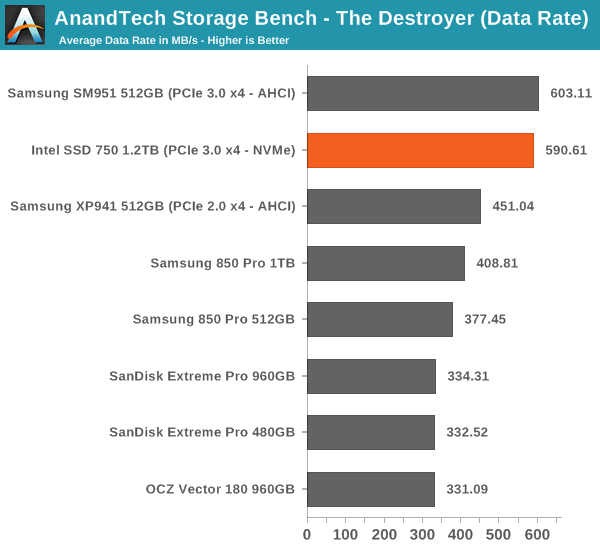
In terms of throughput, the SSD 750 is actually marginally slower than the SM951, although when you look at latency the SD 750 wins by a large margin. The difference in these scores is explained by Intel's focus on random performance as Intel specifically optimized the firmware for high random IO performance, which does have some impact on the sequential performance. As I've explained above, data rate has more emphasis on large IO size transfers, whereas latency treats all IOs the same regardless of their size.
The number of high latency IOs is also excellent and in fact the best we have tested. The SSD 750 is without a doubt a very consistent drive.


132 Comments
View All Comments
Ethos Evoss - Saturday, April 4, 2015 - link
http://www.thessdreview.com/our-reviews/plextor-m6...Brazos - Monday, April 6, 2015 - link
Does the Plextor use NVMe?Sushisamurai - Saturday, April 4, 2015 - link
I mentioned this on twitter with you already, but Dead Rising 3 on a HDD versus a NVMe SSD comparison would be nice :) would save me the work of doing it and testing it on my own :pAntonAM - Monday, April 6, 2015 - link
I don't understand why both drives have the same endurance if one of them have 3 times more flash? Is it endurance of something else?emn13 - Monday, April 6, 2015 - link
The endurance figure is also *really* low compared to other drives - it works out to around 128TB of total writes - that's on the order of 50 times less than an 850Pro (which is slightly smaller).I'm hoping this is just a really stingy guarrantee, and not representative of the actual drive - otherwise I'd really, recommend against using it.
I mean, running the anandtech destroyer benchmark with its close to 1TB of writes would use up your write-allowance for the next two weeks (put another way, it's cost around 10$ in relation to the 1k drive cost).
edved - Tuesday, April 7, 2015 - link
So how does this compare to the Kingstone HyperX Predator that was recently reviewed and I recently purchased?!eliz82 - Tuesday, April 7, 2015 - link
any chance of testing Kingston HyperX Predator PCIe SSD ?SanX - Tuesday, April 7, 2015 - link
Put down the drain all flash trash and start making full power loss protected ramdrives with flash/harddrive backup. Would be cheap by this time if not slow selfdedtroying flash garbage lying on the way.gospadin - Tuesday, April 7, 2015 - link
In other words, 100x the cost for a marginal improvement in performance?Rustang - Wednesday, April 8, 2015 - link
1) Why would you post a review of a Intel SSD 750 PCIe SSD solution without benchmarking it against the other state of the art Intel PCIe SSD Intel DC P3700 solution?2) Why would you put up sequential/random read/write graphs with pull-downs to display the different hardware results instead of efficiently putting all of the hardware results on ONE graph?