Intel SSD 750 PCIe SSD Review: NVMe for the Client
by Kristian Vättö on April 2, 2015 12:00 PM ESTMixed Random Read/Write Performance
Mixed read/write tests are also a new addition to our test suite. In real world applications a significant portion of workloads are mixed, meaning that there are both read and write IOs. Our Storage Bench benchmarks already illustrate mixed workloads by being based on actual real world IO traces, but until now we haven't had a proper synthetic way to measure mixed performance.
The benchmark is divided into two tests. The first one tests mixed performance with 4KB random IOs at six different read/write distributions starting at 100% reads and adding 20% of writes in each phase. Because we are dealing with a mixed workload that contains reads, the drive is first filled with 128KB sequential data to ensure valid results. Similarly, because the IO pattern is random, I've limited the LBA span to 16GB to ensure that the results aren't affected by IO consistency. The queue depth of the 4KB random test is three.
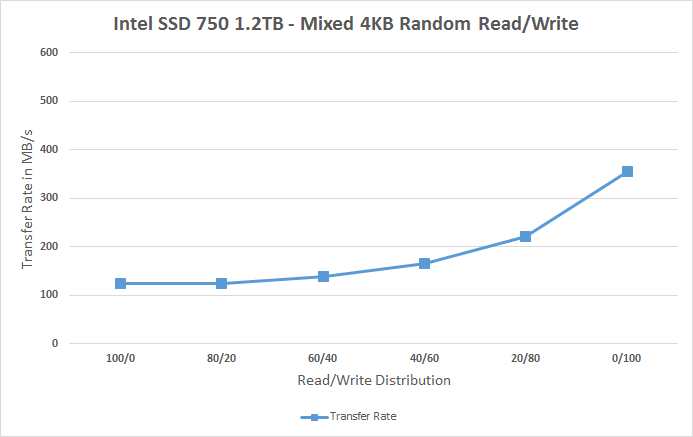
Again, for the sake of readability, I provide both an average based bar graph as well as a line graph with the full data on it. The bar graph represents an average of all six read/write distribution data rates for quick comparison, whereas the line graph includes a separate data point for each tested distribution.
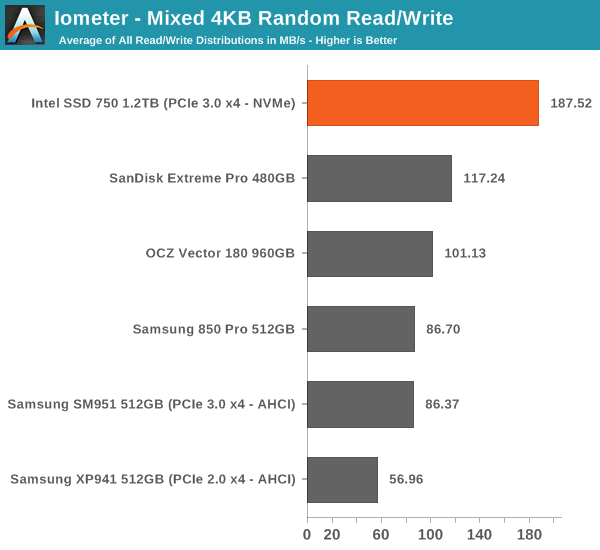
The SSD 750 does very well in mixed random workloads, especially when compared to the SM951 that is slower than most high-end SATA drives. The performance scales quite nicely as the portion of writes is increased.
 |
|||||||||
Mixed Sequential Read/Write Performance
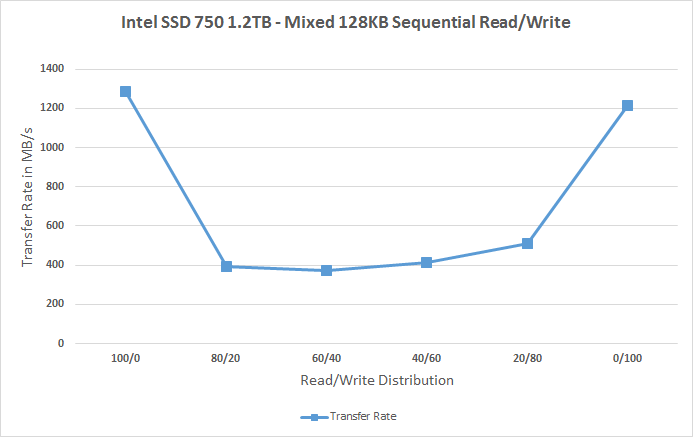
The sequential mixed workload tests are also tested with a full drive, but I've not limited the LBA range as that's not needed with sequential data patterns. The queue depth for the tests is one.
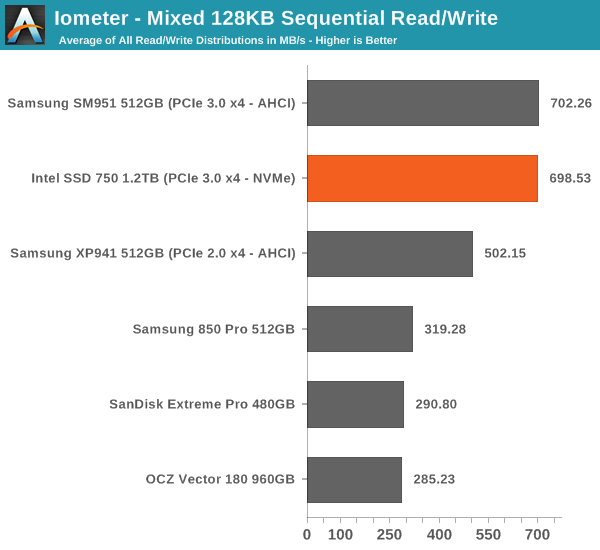
In mixed sequential workloads, however, the SSD 750 and SM951 are practically indentical. Both deliver excellent performance at 100% reads and writes, but the performance does drop significantly once reads and writes are mixed. Even with the drop, the two push out 400MB/s whereas most SATA drives manage ~200MB/s, so PCIe certainly has a big advantage here.
 |
|||||||||


132 Comments
View All Comments
Kristian Vättö - Friday, April 3, 2015 - link
As I explained in the article, I see no point in testing such high queue depths in a client-oriented review because the portion of such IOs is marginal. We are talking about a fraction of a percent, so while it would show big numbers it has no relevance to the end-user.voicequal - Saturday, April 4, 2015 - link
Since you feel strongly enough to levy a personal attack, could you also explain why you think QD128 is important? Anandtech's storage benchmarks are likely a much better indication of user experience unless you have a very specific workload in mind.d2mw - Friday, April 3, 2015 - link
Guys why are you cutpasting the same old specs table and formulaic article? For a review of the first consumer NVMe I'm sorely disappointed you didn't touch on latency metrics: one of the most important improvements with the NVMe busKristian Vättö - Friday, April 3, 2015 - link
There are several latency graphs in the article and I also suggest that you read the following article to better understand what latency and other storage metrics actually mean (hint: latency isn't really different from IOPS and throughput).http://www.anandtech.com/show/8319/samsung-ssd-845...
Per Hansson - Friday, April 3, 2015 - link
Hi Kristian, what evidence do you have that the firmware in the SSD 750 is any different from that found in the DC P3600 / P3700?According to leaked reports released before they have the same firmware: http://www.tweaktown.com/news/43331/new-consumer-i...
And if you read the Intel changelog you see in firmware 8DV10130: "Drive sub-4KB sequential write performance may be below 1MB/sec"
http://downloadmirror.intel.com/23931/eng/Intel_SS...
Which was exactly what you found in the original review of the P3700:
http://www.anandtech.com/show/8147/the-intel-ssd-d...
http://www.anandtech.com/bench/product/1239
Care to retest with the new firmware?
I suspect you will get identical performance.
Per Hansson - Saturday, April 4, 2015 - link
I should be more clear: I mean that you retest the P3700.And obviously the performance of the 750 wont match that, as it is based of the P3500.
But I think you get what I mean anyway ;)
djsvetljo - Friday, April 3, 2015 - link
I am unclear of which connector will this use. Does it use the video card PCI-E port?I have MSI Z97 MATE board that has one PCI-E gen3 x16 and one PCI-E gen2 x 4. Will I be able to use it and will I be limited somehow?
DanNeely - Friday, April 3, 2015 - link
if you use the 2.0 x4 slot your maximum throughput will top out at 2gb/sec. For client workloads this probably won't matter much since only some server workloads can hit situations where the drive can exceed that rate.djsvetljo - Friday, April 3, 2015 - link
So it uses the GPU express port although the card pins are visually shorter ?eSyr - Friday, April 3, 2015 - link
> although in real world the maximum bandwidth is about 3.2GB/s due to PCIe inefficiencyWhat does this phrase mean? If you're referring to 8b10b encoding, this is plainly false, since PCIe gen 3 utilized 128b130b coding. If you're referring to the overheds related to TLP and DLLP headers, this is depends on device's and PCIe RC's maximum transaction size. But, even with (minimal) 128 byte limit it would be 3.36 GB/s. In fact, modern PCIe RCs support much larger TLPs, thus eliminating header-related overheads.