Intel SSD 750 PCIe SSD Review: NVMe for the Client
by Kristian Vättö on April 2, 2015 12:00 PM ESTAnandTech Storage Bench - Light
The Light trace is designed to be an accurate illustration of basic usage. It's basically a subset of the Heavy trace, but we've left out some workloads to reduce the writes and make it more read intensive in general.
| AnandTech Storage Bench - Light - Specs | ||||||||||||
| Reads | 372,630 | |||||||||||
| Writes | 459,709 | |||||||||||
| Total IO Operations | 832,339 | |||||||||||
| Total GB Read | 17.97 GB | |||||||||||
| Total GB Written | 23.25 GB | |||||||||||
| Average Queue Depth | ~4.6 | |||||||||||
| Focus | Basic, light IO usage | |||||||||||
The Light trace still has more writes than reads, but a very light workload would be even more read-centric (think web browsing, document editing, etc). It has about 23GB of writes, which would account for roughly two or three days of average usage (i.e. 7-11GB per day).
| AnandTech Storage Bench - Light - IO Breakdown | |||||||||||
| IO Size | <4KB | 4KB | 8KB | 16KB | 32KB | 64KB | 128KB | ||||
| % of Total | 6.2% | 27.6% | 2.4% | 8.0% | 6.5% | 4.8% | 26.4% | ||||
The IO distribution of the Light trace is very similar to the Heavy trace with slightly more IOs being 128KB. About 70% of the IOs are sequential, though, so that is a major difference compared to the Heavy trace.
| AnandTech Storage Bench - Light - QD Breakdown | ||||||||||||
| Queue Depth | 1 | 2 | 3 | 4-5 | 6-10 | 11-20 | 21-32 | >32 | ||||
| % of Total | 73.4% | 16.8% | 2.6% | 2.3% | 3.1% | 1.5% | 0.2% | 0.2% | ||||
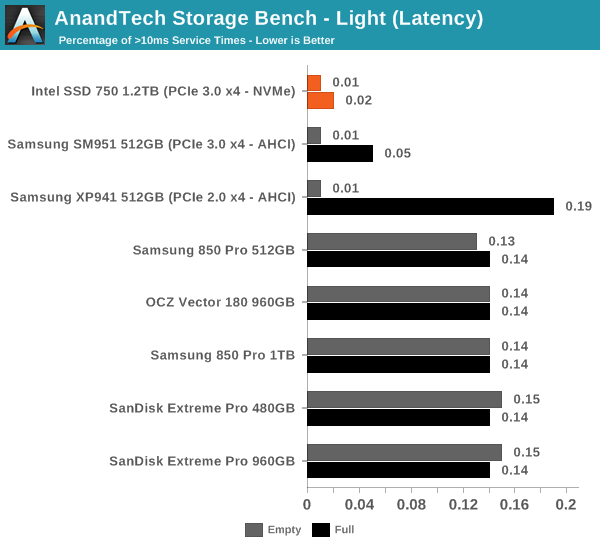
Over 90% of the IOs have a queue depth of one or two, which further proves the importance of low queue depth performance.
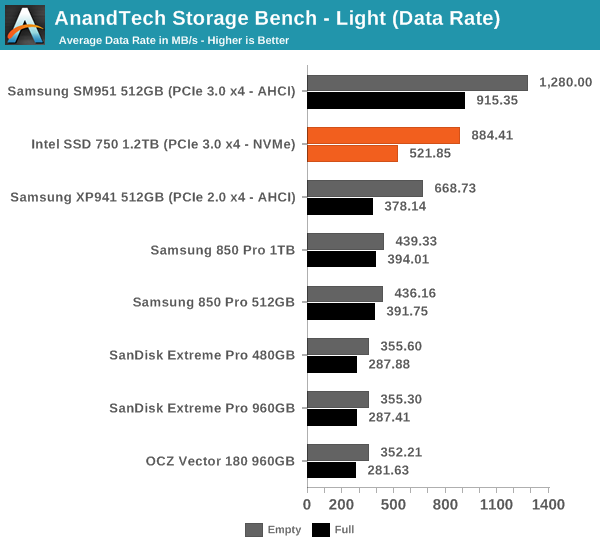
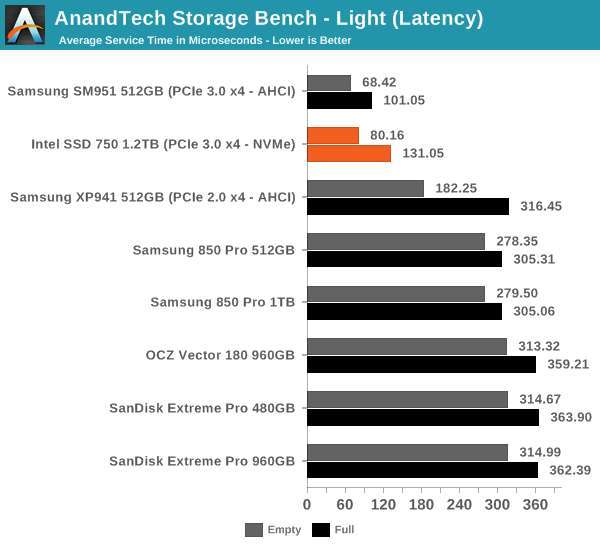
The same trend continues in our Light trace where the SM951 is still the king of the hill. It's obvious that Intel didn't design the SSD 750 with such light workloads in mind as ultimately you need to have a relatively IO intensive workload to get the full benefit of PCIe and NVMe.


132 Comments
View All Comments
Ethos Evoss - Saturday, April 4, 2015 - link
http://www.thessdreview.com/our-reviews/plextor-m6...Brazos - Monday, April 6, 2015 - link
Does the Plextor use NVMe?Sushisamurai - Saturday, April 4, 2015 - link
I mentioned this on twitter with you already, but Dead Rising 3 on a HDD versus a NVMe SSD comparison would be nice :) would save me the work of doing it and testing it on my own :pAntonAM - Monday, April 6, 2015 - link
I don't understand why both drives have the same endurance if one of them have 3 times more flash? Is it endurance of something else?emn13 - Monday, April 6, 2015 - link
The endurance figure is also *really* low compared to other drives - it works out to around 128TB of total writes - that's on the order of 50 times less than an 850Pro (which is slightly smaller).I'm hoping this is just a really stingy guarrantee, and not representative of the actual drive - otherwise I'd really, recommend against using it.
I mean, running the anandtech destroyer benchmark with its close to 1TB of writes would use up your write-allowance for the next two weeks (put another way, it's cost around 10$ in relation to the 1k drive cost).
edved - Tuesday, April 7, 2015 - link
So how does this compare to the Kingstone HyperX Predator that was recently reviewed and I recently purchased?!eliz82 - Tuesday, April 7, 2015 - link
any chance of testing Kingston HyperX Predator PCIe SSD ?SanX - Tuesday, April 7, 2015 - link
Put down the drain all flash trash and start making full power loss protected ramdrives with flash/harddrive backup. Would be cheap by this time if not slow selfdedtroying flash garbage lying on the way.gospadin - Tuesday, April 7, 2015 - link
In other words, 100x the cost for a marginal improvement in performance?Rustang - Wednesday, April 8, 2015 - link
1) Why would you post a review of a Intel SSD 750 PCIe SSD solution without benchmarking it against the other state of the art Intel PCIe SSD Intel DC P3700 solution?2) Why would you put up sequential/random read/write graphs with pull-downs to display the different hardware results instead of efficiently putting all of the hardware results on ONE graph?