Intel SSD 750 PCIe SSD Review: NVMe for the Client
by Kristian Vättö on April 2, 2015 12:00 PM ESTAnandTech Storage Bench - Heavy
While The Destroyer focuses on sustained and worst-case performance by hammering the drive with nearly 1TB worth of writes, the Heavy trace provides a more typical enthusiast and power user workload. By writing less to the drive, the Heavy trace doesn't drive the SSD into steady-state and thus the trace gives us a good idea of peak performance combined with some basic garbage collection routines.
| AnandTech Storage Bench - Heavy | ||||||||||||
| Workload | Description | Applications Used | ||||||||||
| Photo Editing | Import images, edit, export | Adobe Photoshop | ||||||||||
| Gaming | Pllay games, load levels | Starcraft II, World of Warcraft | ||||||||||
| Content Creation | HTML editing | Dreamweaver | ||||||||||
| General Productivity | Browse the web, manage local email, document creation, application install, virus/malware scan | Chrome, IE10, Outlook, Windows 8, AxCrypt, uTorrent, AdAware | ||||||||||
| Application Development | Compile Chromium | Visual Studio 2008 | ||||||||||
The Heavy trace drops virtualization from the equation and goes a bit lighter on photo editing and gaming, making it more relevant to the majority of end-users.
| AnandTech Storage Bench - Heavy - Specs | ||||||||||||
| Reads | 2.17 million | |||||||||||
| Writes | 1.78 million | |||||||||||
| Total IO Operations | 3.99 million | |||||||||||
| Total GB Read | 48.63 GB | |||||||||||
| Total GB Written | 106.32 GB | |||||||||||
| Average Queue Depth | ~4.6 | |||||||||||
| Focus | Peak IO, basic GC routines | |||||||||||
The Heavy trace is actually more write-centric than The Destroyer is. A part of that is explained by the lack of virtualization because operating systems tend to be read-intensive, be that a local or virtual system. The total number of IOs is less than 10% of The Destroyer's IOs, so the Heavy trace is much easier for the drive and doesn't even overwrite the drive once.
| AnandTech Storage Bench - Heavy - IO Breakdown | |||||||||||
| IO Size | <4KB | 4KB | 8KB | 16KB | 32KB | 64KB | 128KB | ||||
| % of Total | 7.8% | 29.2% | 3.5% | 10.3% | 10.8% | 4.1% | 21.7% | ||||
The Heavy trace has more focus on 16KB and 32KB IO sizes, but more than half of the IOs are still either 4KB or 128KB. About 43% of the IOs are sequential with the rest being slightly more full random than pseudo-random.
| AnandTech Storage Bench - Heavy - QD Breakdown | ||||||||||||
| Queue Depth | 1 | 2 | 3 | 4-5 | 6-10 | 11-20 | 21-32 | >32 | ||||
| % of Total | 63.5% | 10.4% | 5.1% | 5.0% | 6.4% | 6.0% | 3.2% | 0.3% | ||||
In terms of queue depths the Heavy trace is even more focused on very low queue depths with three fourths happening at queue depth of one or two.
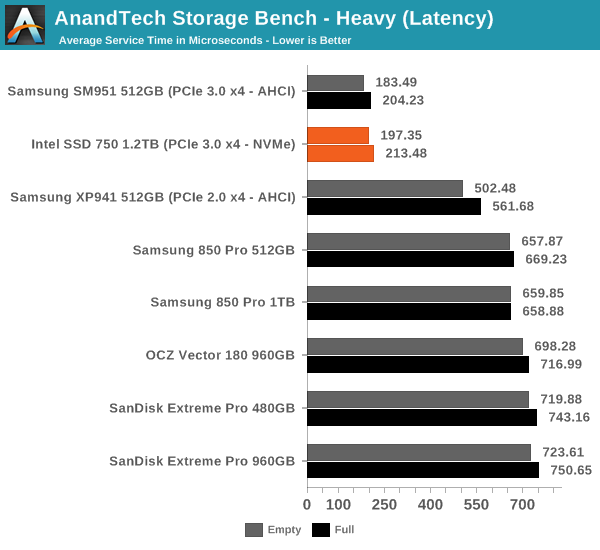
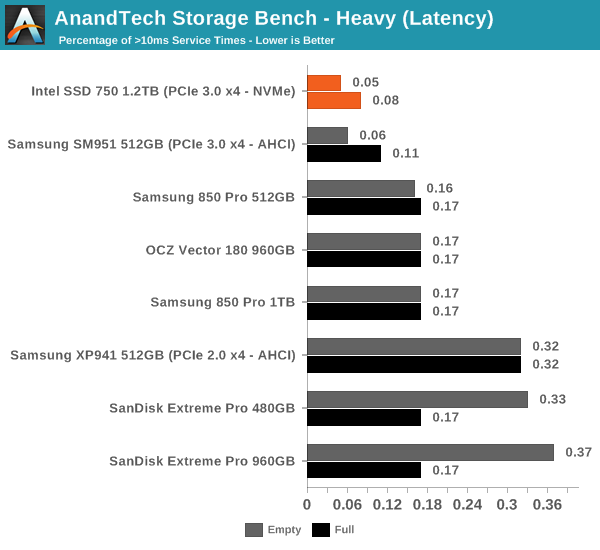
I'm reporting the same performance metrics as in The Destroyer benchmark, but I'm running the drive in both empty and full states. Some manufacturers tend to focus intensively on peak performance on an empty drive, but in reality the drive will always contain some data. Testing the drive in full state gives us valuable information whether the drive loses performance once it's filled with data.
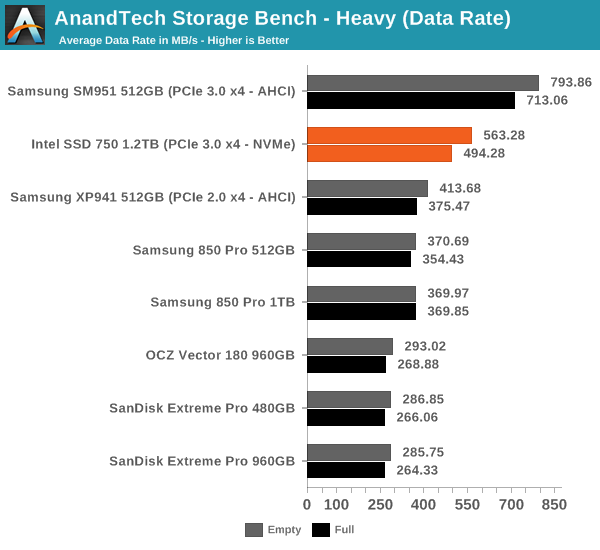
It turns out that the SM951 is overall faster than the SSD 750 in our heavy trace as it beats the SSD 750 in both data rate and average latency. I was expecting the SSD 750 to do better due to NVMe, but it looks like the SM951 is a very capable drive despite lacking NVMe (although there appears to be an NVMe version too after all). On the other hand, I'm not too surprised because the SM951 has specifically been built for client workloads, whereas the SSD 750 has an enterprise heritage and even on the client side it's designed for the most intensive workloads.


132 Comments
View All Comments
Kristian Vättö - Friday, April 3, 2015 - link
As I explained in the article, I see no point in testing such high queue depths in a client-oriented review because the portion of such IOs is marginal. We are talking about a fraction of a percent, so while it would show big numbers it has no relevance to the end-user.voicequal - Saturday, April 4, 2015 - link
Since you feel strongly enough to levy a personal attack, could you also explain why you think QD128 is important? Anandtech's storage benchmarks are likely a much better indication of user experience unless you have a very specific workload in mind.d2mw - Friday, April 3, 2015 - link
Guys why are you cutpasting the same old specs table and formulaic article? For a review of the first consumer NVMe I'm sorely disappointed you didn't touch on latency metrics: one of the most important improvements with the NVMe busKristian Vättö - Friday, April 3, 2015 - link
There are several latency graphs in the article and I also suggest that you read the following article to better understand what latency and other storage metrics actually mean (hint: latency isn't really different from IOPS and throughput).http://www.anandtech.com/show/8319/samsung-ssd-845...
Per Hansson - Friday, April 3, 2015 - link
Hi Kristian, what evidence do you have that the firmware in the SSD 750 is any different from that found in the DC P3600 / P3700?According to leaked reports released before they have the same firmware: http://www.tweaktown.com/news/43331/new-consumer-i...
And if you read the Intel changelog you see in firmware 8DV10130: "Drive sub-4KB sequential write performance may be below 1MB/sec"
http://downloadmirror.intel.com/23931/eng/Intel_SS...
Which was exactly what you found in the original review of the P3700:
http://www.anandtech.com/show/8147/the-intel-ssd-d...
http://www.anandtech.com/bench/product/1239
Care to retest with the new firmware?
I suspect you will get identical performance.
Per Hansson - Saturday, April 4, 2015 - link
I should be more clear: I mean that you retest the P3700.And obviously the performance of the 750 wont match that, as it is based of the P3500.
But I think you get what I mean anyway ;)
djsvetljo - Friday, April 3, 2015 - link
I am unclear of which connector will this use. Does it use the video card PCI-E port?I have MSI Z97 MATE board that has one PCI-E gen3 x16 and one PCI-E gen2 x 4. Will I be able to use it and will I be limited somehow?
DanNeely - Friday, April 3, 2015 - link
if you use the 2.0 x4 slot your maximum throughput will top out at 2gb/sec. For client workloads this probably won't matter much since only some server workloads can hit situations where the drive can exceed that rate.djsvetljo - Friday, April 3, 2015 - link
So it uses the GPU express port although the card pins are visually shorter ?eSyr - Friday, April 3, 2015 - link
> although in real world the maximum bandwidth is about 3.2GB/s due to PCIe inefficiencyWhat does this phrase mean? If you're referring to 8b10b encoding, this is plainly false, since PCIe gen 3 utilized 128b130b coding. If you're referring to the overheds related to TLP and DLLP headers, this is depends on device's and PCIe RC's maximum transaction size. But, even with (minimal) 128 byte limit it would be 3.36 GB/s. In fact, modern PCIe RCs support much larger TLPs, thus eliminating header-related overheads.