The Samsung SSD 850 EVO mSATA/M.2 Review
by Kristian Vättö on March 31, 2015 10:00 AM ESTRandom Read Performance
One of the major changes in our 2015 test suite is the synthetic Iometer tests we run. In the past we used to test just one or two queue depths, but real world workloads always contain a mix of different queue depths as shown by our Storage Bench traces. To get the full scope in performance, I'm now testing various queue depths starting from one and going all the way to up to 32. I'm not testing every single queue depth, but merely how the throughput scales with the queue depth. I'm using exponential scaling, meaning that the tested queue depths increase in powers of two (i.e. 1, 2, 4, 8...).
Read tests are conducted on a full drive because that is the only way to ensure that the results are valid (testing with an empty drive can substantially inflate the results and in reality the data you are reading is always valid rather than full of zeros). Each queue depth is tested for three minutes and there is no idle time between the tests.
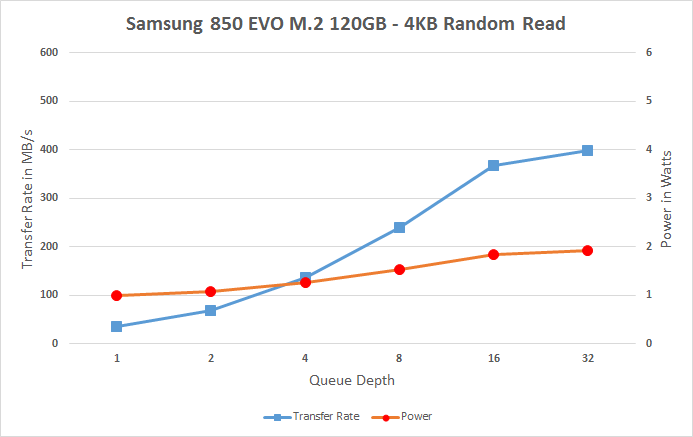
I'm also reporting two metrics now. For the bar graph, I've taken the average of QD1, QD2 and QD4 data rates, which are the most relevant queue depths for client workloads. This allows for easy and quick comparison between drives. In addition to the bar graph, I'm including a line graph, which shows the performance scaling across all queue depths. To keep the line graphs readable, each drive has its own graph, which can be selected from the drop-down menu.
I'm also plotting power for SATA drives and will be doing the same for PCIe drives as soon as I have the system set up properly. Our datalogging multimeter logs power consumption every second, so I report the average for every queue depth to see how the power scales with the queue depth and performance.
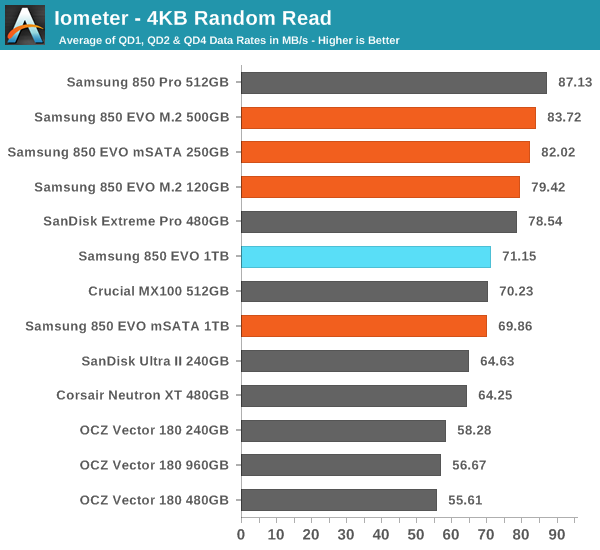
Random read performance has always been Samsung's strength and particularly the 500GB and smaller capacities do well thanks to the faster MGX controller.
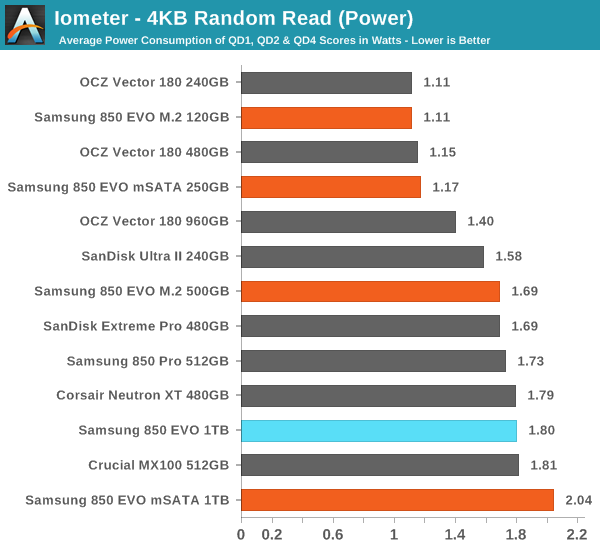
Power consumption is also good, although the 1TB model sips quite a bit of power.
 |
|||||||||
The performance scales nicely with the queue depth too.
Random Write Performance
Write performance is tested in the same way as read performance, except that the drive is in a secure erased state and the LBA span is limited to 16GB. We already test performance consistency separately, so a secure erased drive and limited LBA span ensures that the results here represent peak performance rather than sustained performance.
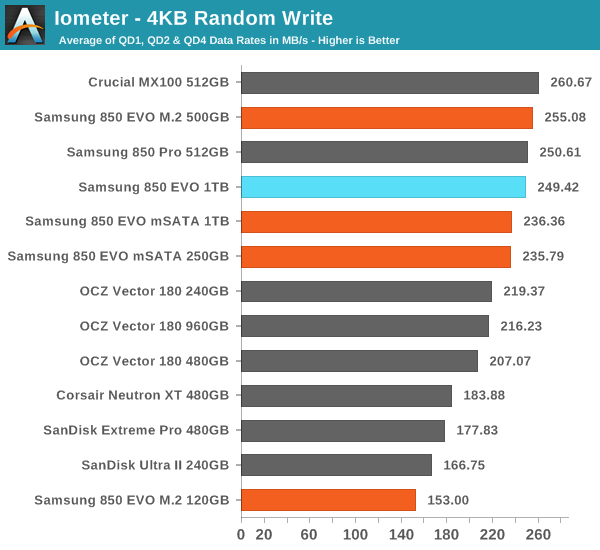
Random write performance is equally strong, which is mostly thanks to TurboWrite.
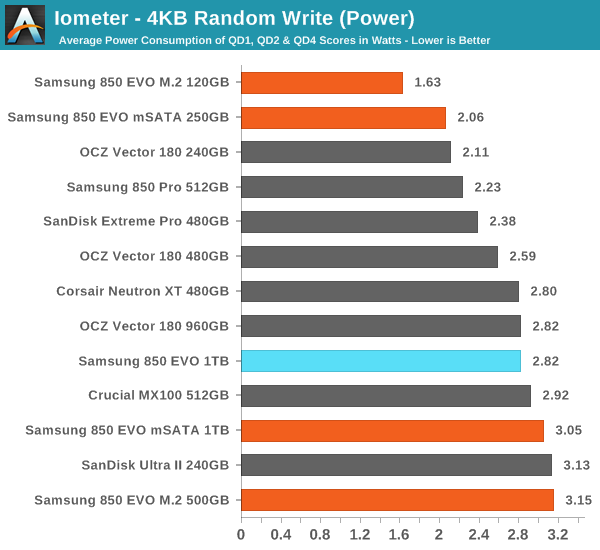
Power consumption is decent as well, and while the larger capacities are more power hungry the difference to competing drives isn't substantial.
 |
|||||||||
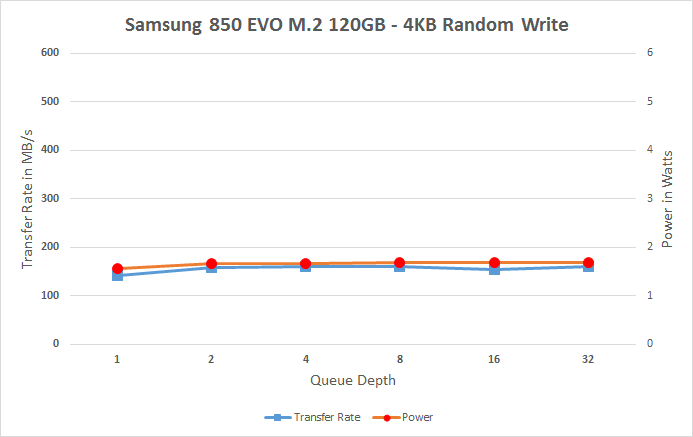
Since the 120GB SKU has less parallelism due to having less NAND, its performance doesn't scale at all with the queue depth (QD1 is already saturating the available NAND bandwidth), but the other models scale pretty nicely. You do see a slight drop in performance after the TurboWrite buffer has been filled, but in client workloads it's unlikely that you will be filling the buffer at once like our tests do.


58 Comments
View All Comments
WackyDan - Saturday, April 4, 2015 - link
Eh... Nope. These won't work in the ThinkPads.blanarahul - Tuesday, March 31, 2015 - link
Hopefully, this drive will put an end to the mSATA/M.2 versions of the 840 non-EVO that companies are shipping in their laptops.Samus - Tuesday, March 31, 2015 - link
DoH! I just paid $20 more for the M550 (basically the MX100) 512GB M2 drive, which is double-sided and needs to be crammed into my laptop :\kgh00007 - Tuesday, March 31, 2015 - link
Hey, is there any chance you could fill one of these m.2 drives with data, power it off for a month then check the read speeds when you power it back on?I need some sort of evidence that this TLC V-nand does not have the same issues as the TLC in the 840 EVO.
Otherwise I'm not going to be able to buy one of these!
Cheers!
goodyes - Wednesday, April 1, 2015 - link
What the hell does not the charts compares with 840 ev msata ? Bad numbers Why not true sequential test ??And this site posting SUCKS, Why in the world I cannot use my facebook or so login, Did you know about disquss ? Get out the absurd captcha that fucking me 30 times or so trying to get a magical potion to know what the words saying,. THIS IS NOT ADVANCE IN TECH THIS IS TRASH
Kristian Vättö - Wednesday, April 1, 2015 - link
This is the third review with the new 2015 SSD Suite and I've only had limited time to test drives, hence the lack of 840 EVO in the graphs.goodyes - Wednesday, April 1, 2015 - link
Ya, but results that I have a 1TB 840 msata and write sequential at more than 500MBps around 520max MBps, and now I see than new 850 msata tops at ?? 480MBps ?? cannot be possible what my eyes look, AND WHY THE HELL NO ONE REVIEWER COMPARE With olders 840 msata, so I must think that all of you guys are a paid reviewers and you get money from samsung, if not, YOU MUST compare to older modelcgorange - Wednesday, April 1, 2015 - link
Other than providing samples, I can assure you that Samsung doesn't pay Anandtech to review its productsEkitrak - Wednesday, April 1, 2015 - link
The Final Words page has 2 entries of "Samsung 840 EVO mSATA" on the Amazon Price Comparison. I'm guessing this is an error and one of them is supposed to be the Sata III version?Kristian Vättö - Wednesday, April 1, 2015 - link
I'm not seeing this -- maybe you accidentally mixed up the 850 EVO mSATA and 840 EVO mSATA as they are both in the table (or maybe this was already fixed by another editor).