Samsung SM951 (512GB) PCIe SSD Review
by Kristian Vättö on February 24, 2015 8:00 AM ESTPerformance Consistency
We've been looking at performance consistency since the Intel SSD DC S3700 review in late 2012 and it has become one of the cornerstones of our SSD reviews. Back in the days many SSD vendors were only focusing on high peak performance, which unfortunately came at the cost of sustained performance. In other words, the drives would push high IOPS in certain synthetic scenarios to provide nice marketing numbers, but as soon as you pushed the drive for more than a few minutes you could easily run into hiccups caused by poor performance consistency.
Once we started exploring IO consistency, nearly all SSD manufacturers made a move to improve consistency and for the 2015 suite, I haven't made any significant changes to the methodology we use to test IO consistency. The biggest change is the move from VDBench to Iometer 1.1.0 as the benchmarking software and I've also extended the test from 2000 seconds to a full hour to ensure that all drives hit steady-state during the test.
For better readability, I now provide bar graphs with the first one being an average IOPS of the last 400 seconds and the second graph displaying the standard deviation during the same period. Average IOPS provides a quick look into overall performance, but it can easily hide bad consistency, so looking at standard deviation is necessary for a complete look into consistency.
I'm still providing the same scatter graphs too, of course. However, I decided to dump the logarithmic graphs and go linear-only since logarithmic graphs aren't as accurate and can be hard to interpret for those who aren't familiar with them. I provide two graphs: one that includes the whole duration of the test and another that focuses on the last 400 seconds of the test to get a better scope into steady-state performance.
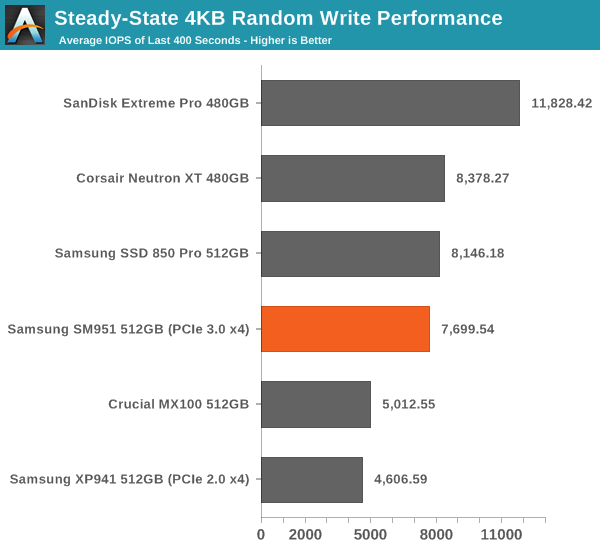
In steady-state performance the SM951 provides a substantial ~70% upgrade over the XP941 and brings performance nearly to the same level with the 850 Pro. Given that the 850 Pro uses faster V-NAND, the steady-state performance is a pleasant surprise and shows that the SM951 is more than a marginal bump from the XP941. Obviously, drives with more default over-provisioning (i.e. Extreme Pro and Neutron XT) provide higher steady-state performance, but Samsung is doing very well with the default 7% over-provisioning.
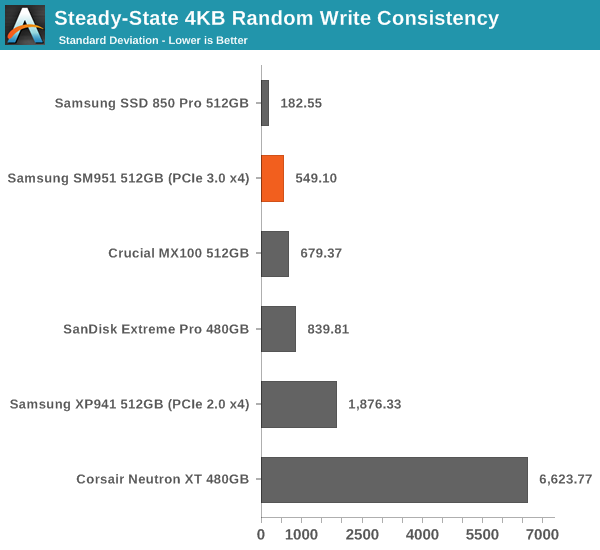
The consistency of the SM951 is also great. The Neutron XT is a living proof of a drive with high average IOPS, but horrible consistency because as we can see in the graph above its standard deviation is up to dozens of times higher compared to the other drives. That's just not acceptable for a modern drive, especially because there are many drives that can consistently provide high IOPS.
 |
|||||||||
| Default | |||||||||
| 25% Over-Provisioning | |||||||||
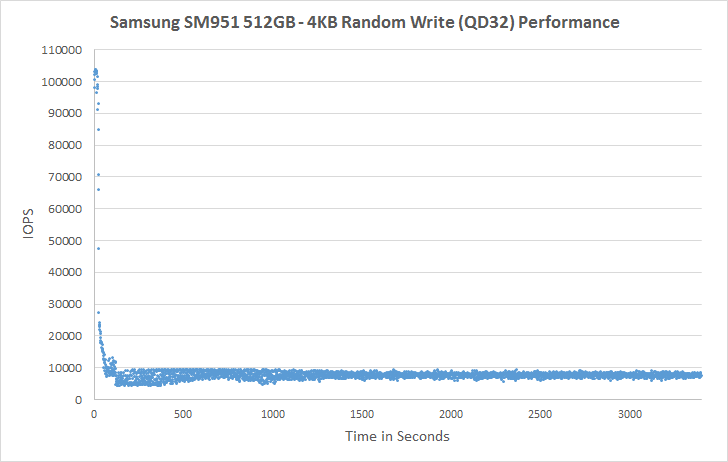
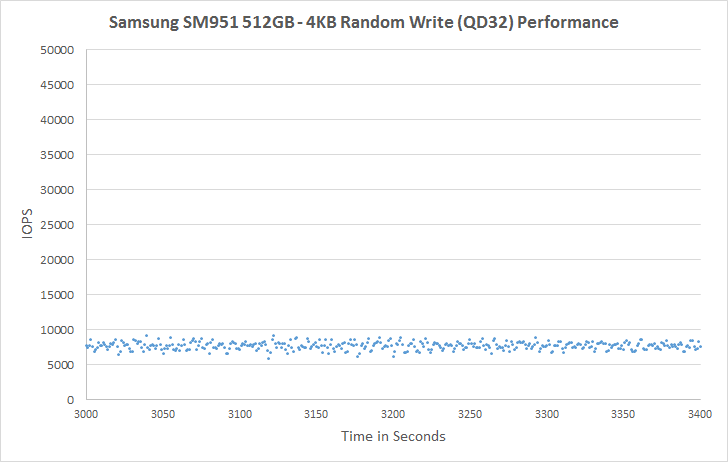
For a dozen seconds or so, the SM951 is actually able to burst out 100K IOPS, but the performance soon drops to below 10K IOPS and eventually evens out at ~7.5K IOPS. The SM951 is very consistent and doesn't experience any notable IOPS drops, whereas the XP941 regularly drops to a few hundred IOs per second. Increasing the over-provisioning to 25% brings the IOPS to about 35K, which is very decent and again much better than the XP941 that still has odd drops in performance.
 |
|||||||||
| Default | |||||||||
| 25% Over-Provisioning | |||||||||


128 Comments
View All Comments
Makaveli - Tuesday, February 24, 2015 - link
I would love to see two Samsung 850Pro 256GB drives in Raid 0 vs this.BPB - Wednesday, February 25, 2015 - link
I was really hoping to see this compared to a RAID 0 setup. I'm considering getting one of these or a competitor's version in 2 or 3 months, but I'm also considering just getting another Samsung SSD and creating a RAID 0 setup.Flash13 - Tuesday, February 24, 2015 - link
Why trust Samsung? I don't anymore.youtard - Tuesday, February 24, 2015 - link
hurr!icrf - Tuesday, February 24, 2015 - link
Suggestion for the graphs/charts picked from a drop down: make them all have the same scale, so when flipping between them, it's easier to compare from a visual shift. Ideally, it wouldn't be a drop down, but a set of checkboxes that would show/hide each line graph on the same chart to see more than one at once. If you're pre-rendering the charts, I understand how that would be a problem.Edgar_in_Indy - Tuesday, February 24, 2015 - link
It would be a lot easier to get excited about this drive if there were real-world numbers to look at. I find it frustrating that most hard drive reviews don't show some basic load times. You know, how long to boot windows, to load a level in a game, copy a huge file, etc.It would make it much easier to judge the relative performance of drives, and decide whether the results justify the upgrade cost.
willis936 - Wednesday, February 25, 2015 - link
While it requires more technical knowledge from the reader it actually gives a lot more useful info. Time to load windows? Is that on first boot after install? After updates? After 100 programs are installed? After 10 r/w cycles? After the drive isfiles filled? With overprovisioning? I'd personally much rather synthetic tests that cover most cases so you can extrapolate subjective performance from it. You just have to know which workloads line up with which tests.DanNeely - Wednesday, February 25, 2015 - link
Page 2 of the article, section "A Word About Storage Benches and Real World Tests".TLDR version: "Too much background IO for consistent results to be possible."
Edgar_in_Indy - Wednesday, February 25, 2015 - link
From that same section: "I know some of you have criticized our benchmarks due to the lack of real world application tests, but the unfortunate truth is that it's close to impossible to build a reliable test suite that can be executed in real time. Especially if you want to test something else than just boot and application launch times, there is simply too many tasks in the background that cannot be properly controlled to guarantee valid results. "Okay, then. So a complicated real-world test is difficult to duplicate. But why can't we at least have the simple "boot and application launch times" he referenced? And what about a large file copy, like I already mentioned? That's something most people could easily relate to. And time to compress a large group of files? Etc.
If the whole idea of an SSD is to do things faster, then it would be helpful to get a stopwatch involved in these types of review, at least a little bit!
Or if it really is "Mission Impossible" to document any real world speed improvements, then I can't help but wonder if this is kind of like people paying premiums for high-performance memory, with very little real-world return.
zodiacfml - Wednesday, February 25, 2015 - link
Why not do a benchmark of a Windows installation in a virtual machine from a RAM disk?