AMD’s 5 GHz Turbo CPU in Retail: The FX-9590 and ASRock 990FX Extreme9 Review
by Ian Cutress on August 9, 2014 8:00 AM ESTMany thanks to...
We must thank the following companies for kindly providing hardware for our test bed:
Thank you to OCZ for providing us with PSUs and SSDs.
Thank you to G.Skill and ADATA for providing us with memory kits.
Thank you to Corsair for providing us with an AX1200i PSU, Corsair H80i CLC and DRAM.
Thank you to ASUS for providing us with the AMD HD7970 GPUs and some IO Testing kit.
Thank you to MSI for providing us with the NVIDIA GTX 770 Lightning GPUs.
Thank you to Rosewill for providing us with PSUs and RK-9100 keyboards.
Thank you to ASRock for providing us with some IO testing kit.
Test Setup
| Test Setup | |
| Processor |
AMD FX-9590 4 Modules, 8 Threads, 4.7 GHz, 5.0 GHz Turbo |
| Motherboards | ASRock 990FX Extreme9 |
| Cooling |
Corsair H80i Thermalright TRUE Copper |
| Power Supply |
OCZ 1250W Gold ZX Series Corsair AX1200i Platinum PSU |
| Memory | G.Skill RipjawsZ 4x4 GB DDR3-1866 9-11-9 Kit |
| Memory Settings | DDR3-1866 8-9-9 |
| Video Cards | MSI GTX 770 Lightning 2GB (1150/1202 Boost) |
| Video Drivers | NVIDIA Drivers 337 |
| Hard Drive | OCZ Vertex 3 256GB |
| Optical Drive | LG GH22NS50 |
| Case | Open Test Bed |
| Operating System | Windows 7 64-bit SP1 |
| USB 2/3 Testing | OCZ Vertex 3 240GB with SATA->USB Adaptor |
| WiFi Testing | D-Link DIR-865L 802.11ac Dual Band Router |
System Benchmarks
Power Consumption
Power consumption was tested on the system as a whole with a wall meter connected to the OCZ 1250W power supply, while in a single MSI GTX 770 Lightning GPU configuration. This power supply is Gold rated, and as I am in the UK on a 230-240 V supply, leads to ~75% efficiency > 50W, and 90%+ efficiency at 250W, which is suitable for both idle and multi-GPU loading. This method of power reading allows us to compare the power management of the UEFI and the board to supply components with power under load, and includes typical PSU losses due to efficiency. These are the real world values that consumers may expect from a typical system (minus the monitor) using this motherboard.
While this method for power measurement may not be ideal, and you feel these numbers are not representative due to the high wattage power supply being used (we use the same PSU to remain consistent over a series of reviews, and the fact that some boards on our test bed get tested with three or four high powered GPUs), the important point to take away is the relationship between the numbers. These boards are all under the same conditions, and thus the differences between them should be easy to spot.
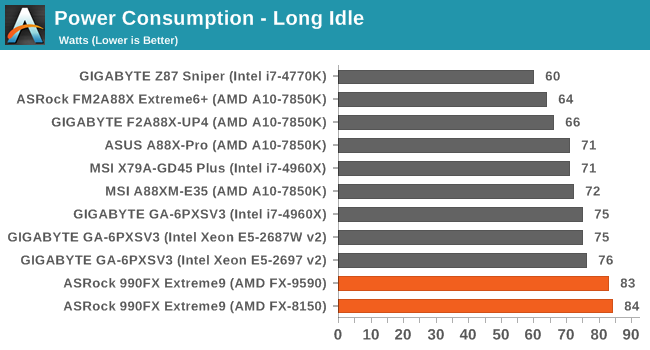
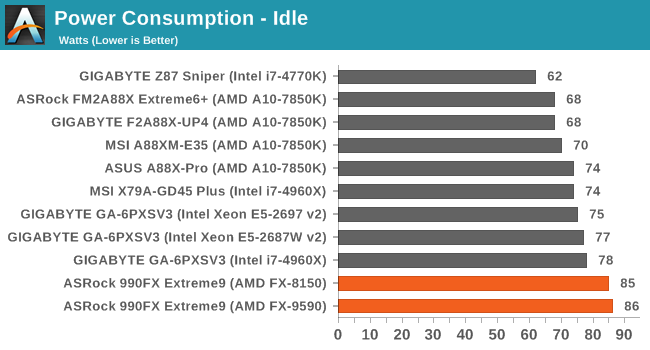
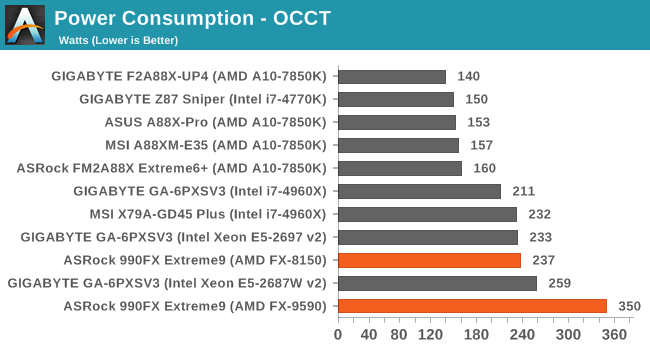
The added power draw of the FX-9590 is quite clear, showing 350W for the full system during a heavy CPU load. However, the idle power draw of the CPU is similar to that of the FX-8150.
Windows 7 POST Time
Different motherboards have different POST sequences before an operating system is initialized. A lot of this is dependent on the board itself, and POST boot time is determined by the controllers on board (and the sequence of how those extras are organized). As part of our testing, we are now going to look at the POST Boot Time - this is the time from pressing the ON button on the computer to when Windows 7 starts loading. (We discount Windows loading as it is highly variable given Windows specific features.) These results are subject to human error, so please allow +/- 1 second in these results.
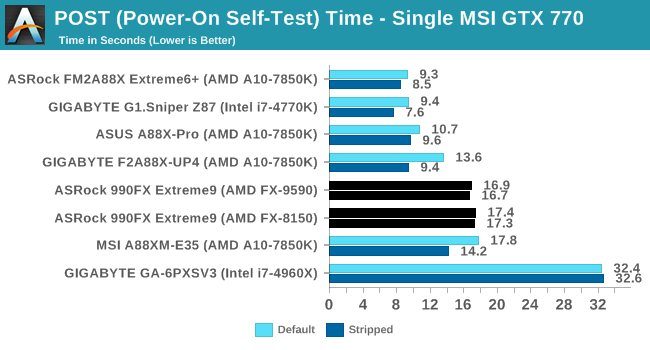
The FX-9590 afforded a shorter POST time than the FX-8150, although both are north of 16 seconds.
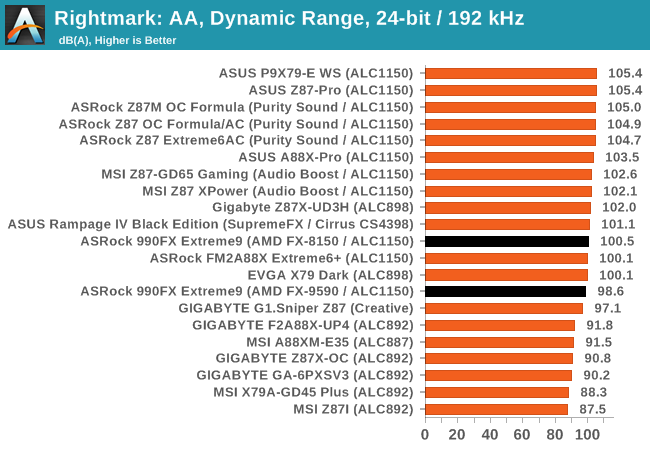
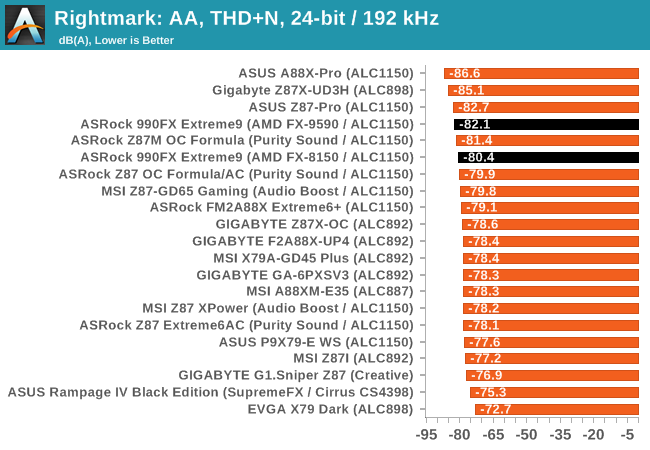
Rightmark Audio Analyzer 6.2.5
The premise behind Rightmark:AA is to test the input and output of the audio system to determine noise levels, range, harmonic distortion, stereo crosstalk and so forth. Rightmark:AA should indicate how well the sound system is built and isolated from electrical interference (either internally or externally). For this test we connect the Line Out to the Line In using a short six inch 3.5mm to 3.5mm high-quality jack, turn the OS speaker volume to 100%, and run the Rightmark default test suite at 192 kHz, 24-bit. The OS is tuned to 192 kHz/24-bit input and output, and the Line-In volume is adjusted until we have the best RMAA value in the mini-pretest. We look specifically at the Dynamic Range of the audio codec used on board, as well as the Total Harmonic Distortion + Noise.
USB Backup
For this benchmark, we run CrystalDiskMark to determine the ideal sequential read and write speeds for the USB port using our 240 GB OCZ Vertex3 SSD with a SATA 6 Gbps to USB 3.0 converter. Then we transfer a set size of files from the SSD to the USB drive using DiskBench, which monitors the time taken to transfer. The files transferred are a 1.52 GB set of 2867 files across 320 folders – 95% of these files are small typical website files, and the rest (90% of the size) are the videos used in the WinRAR test. In an update to pre-Z87 testing, we also run MaxCPU to load up one of the threads during the test which improves general performance up to 15% by causing all the internal pathways to run at full speed.
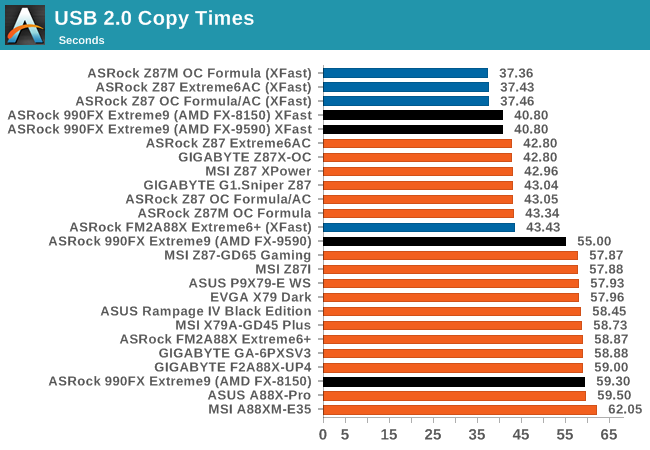
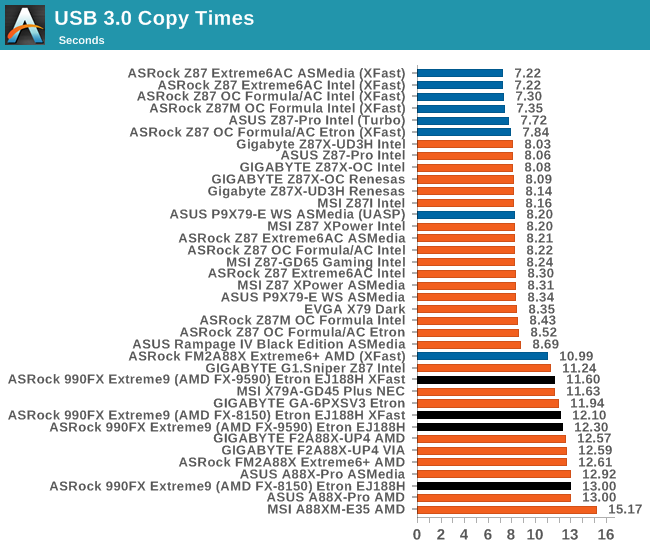
The increase in CPU speed of the FX-9590 gives a measured improvement in standard USB copy times – saving 4.3 seconds over the FX-8150 for USB 2.0 transfers. However using XFast USB eliminated that difference completely. For USB 3.0 transfers, using the Etron controller put a consistent advantage on the side of the FX-9590.
DPC Latency
Deferred Procedure Call latency is a way in which Windows handles interrupt servicing. In order to wait for a processor to acknowledge the request, the system will queue all interrupt requests by priority. Critical interrupts will be handled as soon as possible, whereas lesser priority requests, such as audio, will be further down the line. So if the audio device requires data, it will have to wait until the request is processed before the buffer is filled. If the device drivers of higher priority components in a system are poorly implemented, this can cause delays in request scheduling and process time, resulting in an empty audio buffer – this leads to characteristic audible pauses, pops and clicks. Having a bigger buffer and correctly implemented system drivers obviously helps in this regard. The DPC latency checker measures how much time is processing DPCs from driver invocation – the lower the value will result in better audio transfer at smaller buffer sizes. Results are measured in microseconds and taken as the peak latency while cycling through a series of short HD videos - less than 500 microseconds usually gets the green light, but the lower the better.
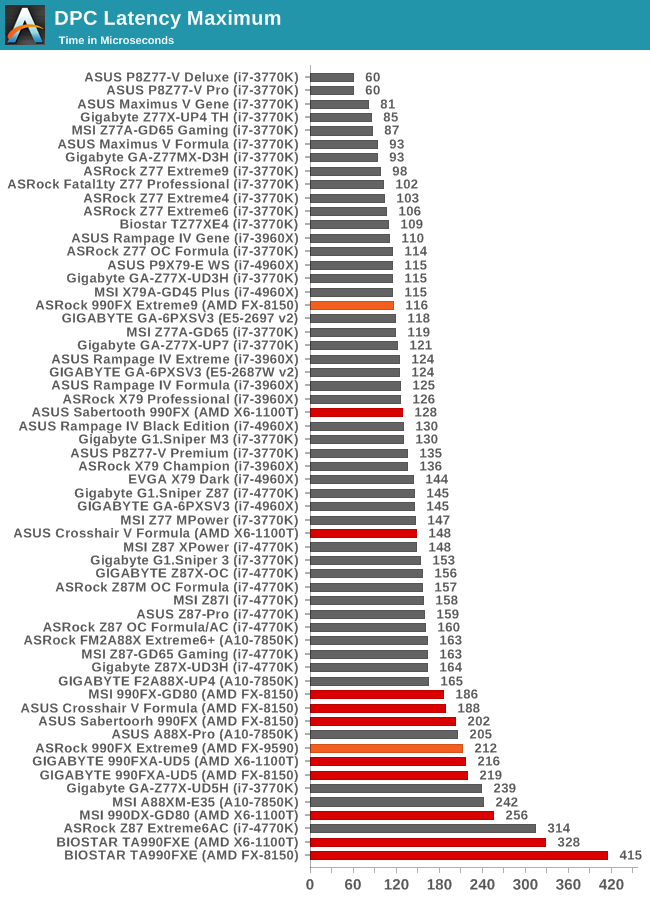
In a surprising twist, it would seem the FX-9590 has a disadvantage for DPC latency. I would have expected the faster processor to have the lower result, but one might speculate that the BIOS is tuned more for the mainstream processors such as the FX-8150. The chipset might also be geared more to the FX-8150 as it was the earlier generation compared to the FX-9590.


146 Comments
View All Comments
Budburnicus - Wednesday, January 14, 2015 - link
+1 EXACTLY my point! People KEEP bringing up fab sizes, but it is a simple TRUTH that a 3 year old 32 nm SandyBridge is FAR faster in nearly every conceivable way - at STOCK speeds no less!Apply a 4.7 GHz overclock (as my SandyBridge system has ) - and the Per Clock (as well as gaming performance!) actually BEATS my Haswell i7-5930K (which with the same Cooler Master Hyper 212 EVO w/dual fans - is at a stable 4.4 Ghz) - in gaming!
Budburnicus - Wednesday, January 14, 2015 - link
*per CORE* - not clock (same IPC obviously)roadapathy - Monday, August 11, 2014 - link
In fact, I argued this point on my Steam Gamers group page and some said I was not fully understanding. I'll laugh a little about that because I talked with an employee of Intel at my work and he has a PhD in electrical engineering from Purdue. He said that I was correct and that the lithography makes a huge differences in power and performance of a CPU. Even if AMD CPUs/APUs are slower per IPC, it still does the job and it still costs much less to produce an entire PC system.Budburnicus - Wednesday, January 14, 2015 - link
Fab size isn't the problem here! A 3 year old i5-2500K or i7-2600K is built with a 32 nm fab and is only a 95 watt TDP part! On top of that, it is QUITE easy to overclock either to 4.7 GHz - and even then the power draw is at least 1/3 less and the CPU will be MUCH faster in EVERY way!Hell, at STOCK speeds, an i7-2600K is faster!
LarsBars - Saturday, August 9, 2014 - link
I wanted to build a Hyper-V lab for my work, so I ended up going with AMD FX. I don't care about overcook and the power consumption argument to me is not a big deal. I got my 8350 and 8320 on sale, and for the number of threads, the cache, and the hardware virtualization support, it was one of the cheapest ways to put together two 32 GB lab servers.Sttm - Saturday, August 9, 2014 - link
So this a fanboy only product? Not sure how anyone else can believe its a better purchase over an i7. Slower in most things, similar cost, multiple times the power usage.TiGr1982 - Saturday, August 9, 2014 - link
Well, for the unbiased customer there is indeed no sense in going with this FX rather than with i7.So, AFAIU, this is indeed a product for die-hard AMD fans. The only problem is that the number of these people is diminishing from year to year, I suppose.
darkich - Saturday, August 9, 2014 - link
What a terrible product.A 220W CPU now days?
Facepalm
gostan - Saturday, August 9, 2014 - link
I know AT team needs to eat. It's just painful to see them try so hard to be easy on AMD.darkich - Sunday, August 10, 2014 - link
+1