AMD’s 5 GHz Turbo CPU in Retail: The FX-9590 and ASRock 990FX Extreme9 Review
by Ian Cutress on August 9, 2014 8:00 AM ESTMany thanks to...
We must thank the following companies for kindly providing hardware for our test bed:
Thank you to OCZ for providing us with PSUs and SSDs.
Thank you to G.Skill and ADATA for providing us with memory kits.
Thank you to Corsair for providing us with an AX1200i PSU, Corsair H80i CLC and DRAM.
Thank you to ASUS for providing us with the AMD HD7970 GPUs and some IO Testing kit.
Thank you to MSI for providing us with the NVIDIA GTX 770 Lightning GPUs.
Thank you to Rosewill for providing us with PSUs and RK-9100 keyboards.
Thank you to ASRock for providing us with some IO testing kit.
Test Setup
| Test Setup | |
| Processor |
AMD FX-9590 4 Modules, 8 Threads, 4.7 GHz, 5.0 GHz Turbo |
| Motherboards | ASRock 990FX Extreme9 |
| Cooling |
Corsair H80i Thermalright TRUE Copper |
| Power Supply |
OCZ 1250W Gold ZX Series Corsair AX1200i Platinum PSU |
| Memory | G.Skill RipjawsZ 4x4 GB DDR3-1866 9-11-9 Kit |
| Memory Settings | DDR3-1866 8-9-9 |
| Video Cards | MSI GTX 770 Lightning 2GB (1150/1202 Boost) |
| Video Drivers | NVIDIA Drivers 337 |
| Hard Drive | OCZ Vertex 3 256GB |
| Optical Drive | LG GH22NS50 |
| Case | Open Test Bed |
| Operating System | Windows 7 64-bit SP1 |
| USB 2/3 Testing | OCZ Vertex 3 240GB with SATA->USB Adaptor |
| WiFi Testing | D-Link DIR-865L 802.11ac Dual Band Router |
System Benchmarks
Power Consumption
Power consumption was tested on the system as a whole with a wall meter connected to the OCZ 1250W power supply, while in a single MSI GTX 770 Lightning GPU configuration. This power supply is Gold rated, and as I am in the UK on a 230-240 V supply, leads to ~75% efficiency > 50W, and 90%+ efficiency at 250W, which is suitable for both idle and multi-GPU loading. This method of power reading allows us to compare the power management of the UEFI and the board to supply components with power under load, and includes typical PSU losses due to efficiency. These are the real world values that consumers may expect from a typical system (minus the monitor) using this motherboard.
While this method for power measurement may not be ideal, and you feel these numbers are not representative due to the high wattage power supply being used (we use the same PSU to remain consistent over a series of reviews, and the fact that some boards on our test bed get tested with three or four high powered GPUs), the important point to take away is the relationship between the numbers. These boards are all under the same conditions, and thus the differences between them should be easy to spot.
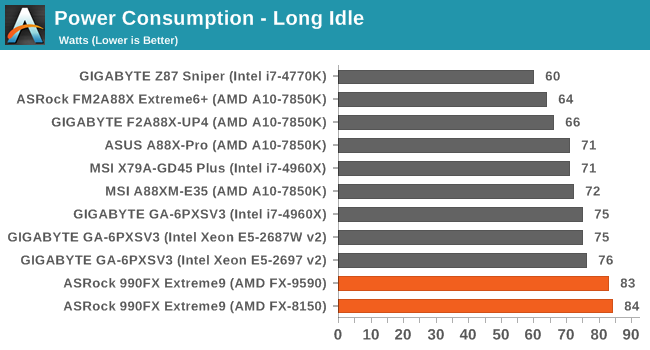
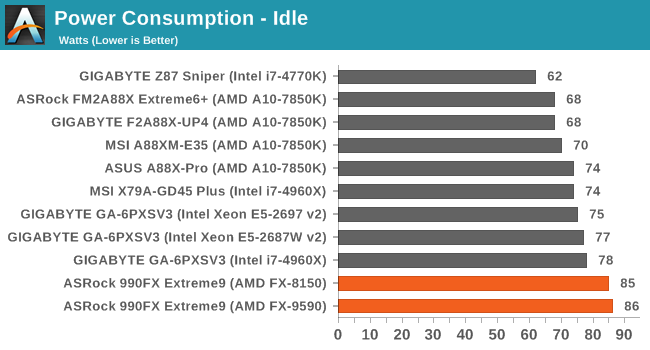
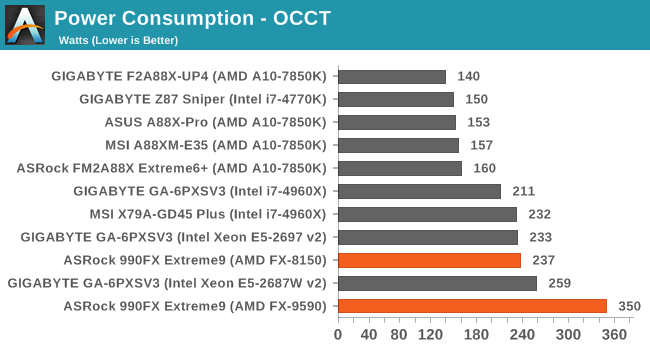
The added power draw of the FX-9590 is quite clear, showing 350W for the full system during a heavy CPU load. However, the idle power draw of the CPU is similar to that of the FX-8150.
Windows 7 POST Time
Different motherboards have different POST sequences before an operating system is initialized. A lot of this is dependent on the board itself, and POST boot time is determined by the controllers on board (and the sequence of how those extras are organized). As part of our testing, we are now going to look at the POST Boot Time - this is the time from pressing the ON button on the computer to when Windows 7 starts loading. (We discount Windows loading as it is highly variable given Windows specific features.) These results are subject to human error, so please allow +/- 1 second in these results.
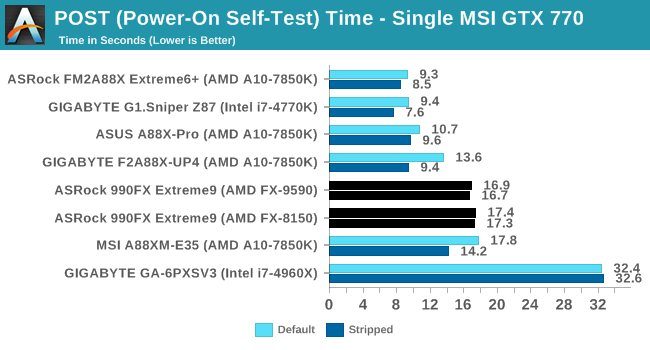
The FX-9590 afforded a shorter POST time than the FX-8150, although both are north of 16 seconds.
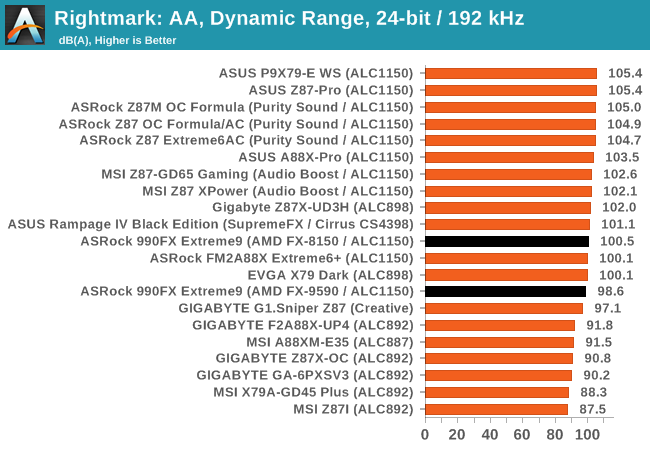
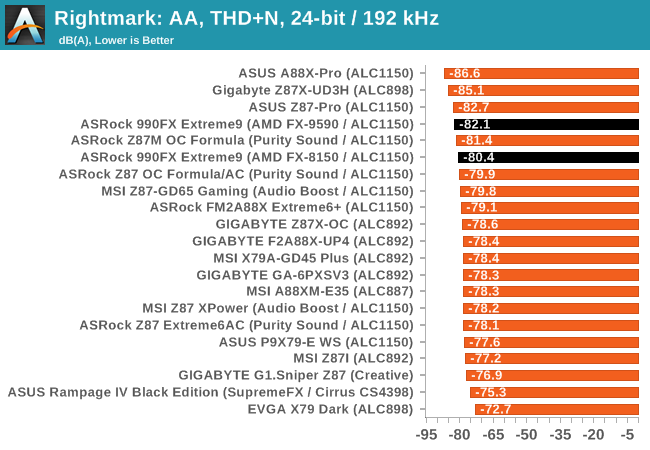
Rightmark Audio Analyzer 6.2.5
The premise behind Rightmark:AA is to test the input and output of the audio system to determine noise levels, range, harmonic distortion, stereo crosstalk and so forth. Rightmark:AA should indicate how well the sound system is built and isolated from electrical interference (either internally or externally). For this test we connect the Line Out to the Line In using a short six inch 3.5mm to 3.5mm high-quality jack, turn the OS speaker volume to 100%, and run the Rightmark default test suite at 192 kHz, 24-bit. The OS is tuned to 192 kHz/24-bit input and output, and the Line-In volume is adjusted until we have the best RMAA value in the mini-pretest. We look specifically at the Dynamic Range of the audio codec used on board, as well as the Total Harmonic Distortion + Noise.
USB Backup
For this benchmark, we run CrystalDiskMark to determine the ideal sequential read and write speeds for the USB port using our 240 GB OCZ Vertex3 SSD with a SATA 6 Gbps to USB 3.0 converter. Then we transfer a set size of files from the SSD to the USB drive using DiskBench, which monitors the time taken to transfer. The files transferred are a 1.52 GB set of 2867 files across 320 folders – 95% of these files are small typical website files, and the rest (90% of the size) are the videos used in the WinRAR test. In an update to pre-Z87 testing, we also run MaxCPU to load up one of the threads during the test which improves general performance up to 15% by causing all the internal pathways to run at full speed.
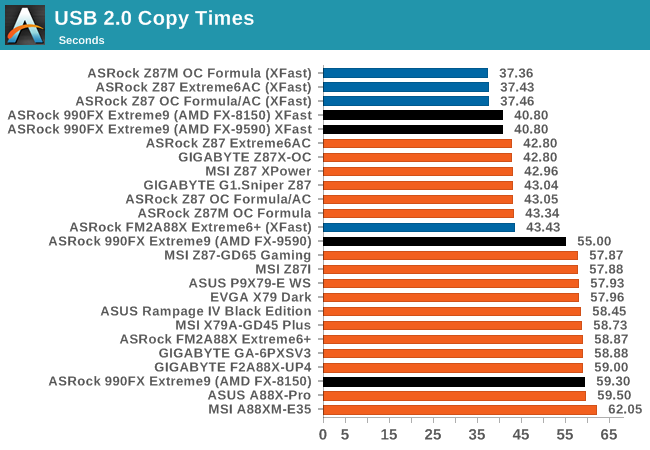
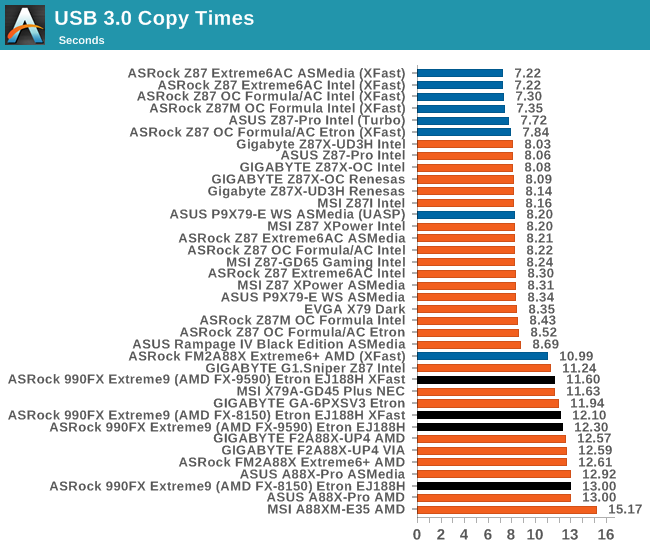
The increase in CPU speed of the FX-9590 gives a measured improvement in standard USB copy times – saving 4.3 seconds over the FX-8150 for USB 2.0 transfers. However using XFast USB eliminated that difference completely. For USB 3.0 transfers, using the Etron controller put a consistent advantage on the side of the FX-9590.
DPC Latency
Deferred Procedure Call latency is a way in which Windows handles interrupt servicing. In order to wait for a processor to acknowledge the request, the system will queue all interrupt requests by priority. Critical interrupts will be handled as soon as possible, whereas lesser priority requests, such as audio, will be further down the line. So if the audio device requires data, it will have to wait until the request is processed before the buffer is filled. If the device drivers of higher priority components in a system are poorly implemented, this can cause delays in request scheduling and process time, resulting in an empty audio buffer – this leads to characteristic audible pauses, pops and clicks. Having a bigger buffer and correctly implemented system drivers obviously helps in this regard. The DPC latency checker measures how much time is processing DPCs from driver invocation – the lower the value will result in better audio transfer at smaller buffer sizes. Results are measured in microseconds and taken as the peak latency while cycling through a series of short HD videos - less than 500 microseconds usually gets the green light, but the lower the better.
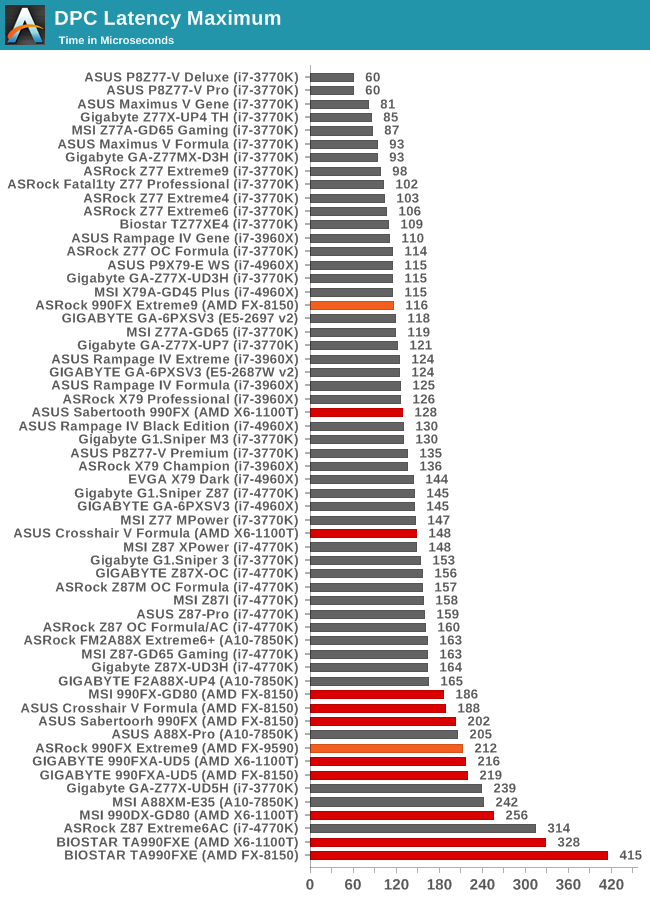
In a surprising twist, it would seem the FX-9590 has a disadvantage for DPC latency. I would have expected the faster processor to have the lower result, but one might speculate that the BIOS is tuned more for the mainstream processors such as the FX-8150. The chipset might also be geared more to the FX-8150 as it was the earlier generation compared to the FX-9590.


146 Comments
View All Comments
TiGr1982 - Saturday, August 9, 2014 - link
No, no FX in the future - at least, not on Bulldozer-derived microarchitectures.Just APUs till 2016 at least.
will1956 - Saturday, August 9, 2014 - link
i've gotten the sabertooth 990FX GEN3 R2.0 and its got pcie 3 x16 with a 8350 and a sapphire 7870 ghz (both OC'ed) and its pretty good although rather greedyTiGr1982 - Saturday, August 9, 2014 - link
It's nice that this kind of boards exist, but, sadly, PCI Express 3.0 is a rarity rather than a norm on AM3+.AMD only has PCI Express 3.0 as a standard on FM2+ with Kaveri APU.
roadapathy - Saturday, August 9, 2014 - link
I see by the comments below that I'm among the rational. AMD is stuck on the 32nm fab process making for a dismal performance experience for us all! My AMD 6-core could boil water. This is great for the cold midwestern American climate but the Summer is unbearable with AMD CPUs. I had waited over 2 years for a 22nm AMD 8 core FX that never appeared. Meanwhile, I'm running the "lower" 95watt CPU. I can't even imagine how it would be with the 220watt. How ridiculous!!RussianSensation - Sunday, August 10, 2014 - link
Exactly!! Someone understands. If AMD could move to 14nm, they could increase the number of modules 50%-100% and lower the power usage at the same time. When you CPU is on 32nm while Intel is soon to launch 14nm Broadwell, the chance of AMD competing in performance or performance/watt is 0%.Death666Angel - Sunday, August 10, 2014 - link
But more cores aren't really the issue for AMD, are they? In multi-threaded stuff they are already doing fine. What they need is better IPC. Even at 5GHz they barely beat i3s of the current generation. Unfortunately the FX-9590 isn't in bench yet, but the FX-8350 even loses to a chip on 32nm (i5-2500k) in most benchmarks except some multi threaded ones. Put an i7-2600k in its place and it loses even more consistently. That is not just a lithography disadvantage, that is a straight up embarrassment from the CPU architecture standpoint. And the fact that they aren't releasing any more FX CPUs based on newer architectures is a slap in the face of any PC enthusiast.TiGr1982 - Monday, August 11, 2014 - link
Indeed; placed my response too.Budburnicus - Wednesday, January 14, 2015 - link
exactly! AMD has HORRIBLE IPC which results in horrible efficiency - ALSO bear in mind that the 3 year old i5 and i7 parts are 32nm fab, and are 95 watt TDP parts - which can easily be clocked at 4.7 Ghz and totally SPANK this CPU in every way!AMD need a totally new architecture to go with a new fabrication, otherwise it will remain meaningless and eat more power. IPC is incredibly important - just because this FX 9590 is much newer than an i7-2600K and therefore has more and newer instruction sets, does NOT mean it performs better! It performs far worse in fact - whilst eating more power - using the same fab size!
TiGr1982 - Monday, August 11, 2014 - link
It's not the manufacturing tech itself - their Bulldozer-derived microarchitecture has drastically slower IPC (Instructions Per Clock). If you you emphasize lithography, then let's compare FX Piledriver from late 2012 on GF 32 nm lithography and Sandy Bridge LGA1155 Core i7 from early 2011 on Intel's 32 nm lithography.Guess what? Sandy Bridge is around 50% faster in single threaded tasks than Pilderiver. At the "same" lithography. Despite the fact that Sandy Bridge i7 has just 9 MB L2+L3 cache, while Piledriver has 16 MB L2+L3 cache. So, AMD's chip has almost twice the amount of cache than Intel's chip and is still 50% slower. So, first, the case with AMD FX is mainly a problem of inappropriate microarchitecture, and only then comes the lithography lag.
So, even if a Cinderella's fairy comes up and magically moves FX Piledriver to Intel's 22 nm or even 14 nm, the resulting tiny Piledriver shrink will still be a Slowpoke in single thread duties - because it is its microarchitecture that prevents it from doing better.
roadapathy - Monday, August 11, 2014 - link
I don't have a complaint about the architecture itself because of the price points. Intel CPU, motherboard and the RAM are all much more expensive! I'd be satisfied with AMD FX series (or the new Kavari) on the 20nm fab process.