Smartphone Audio Quality Testing
by Chris Heinonen on December 8, 2013 5:15 PM EST- Posted in
- Smartphones
- Audio
- Mobile
- Tablets
- Testing
THD+N is a measure of the total harmonic distortion and noise compared to the signal. The lower the number, the less distortion and noise there is relative to the fundamental frequency. THD+N is measured by driving a 1 kHz sine wave at maximum volume. Because there is always some inherent background noise, the THD+N is almost always lowest at maximum output so that is used for the measurement.
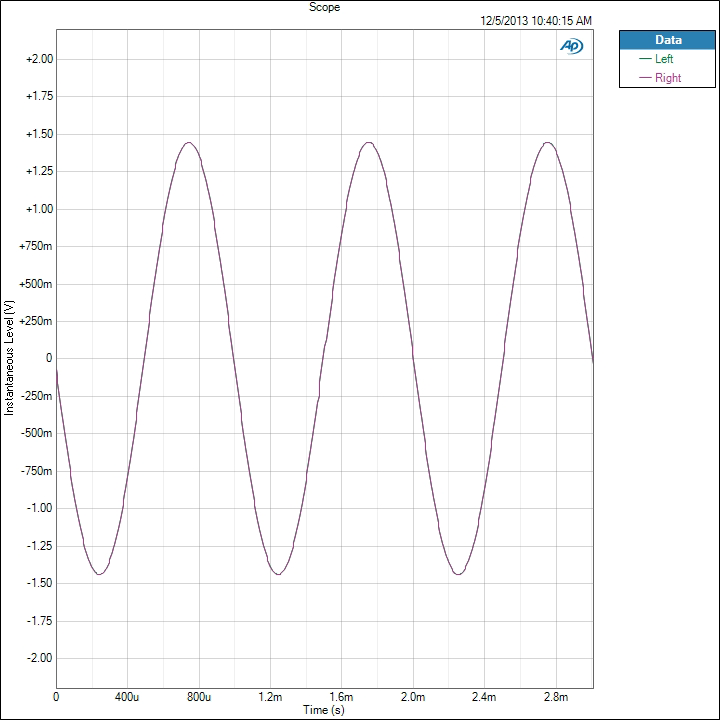
There are two results that we take from this: a sine wave and a FFT spectrum. On the sine wave both channels should line up perfectly, and it should be as close to an accurate sine wave as possible. On the FFT we want to see a peak at 1 kHz and everything else as low as possible. The most common artifact you will see are harmonic sidebands at multiples of 1 kHz.
For an example of data that looks good, here is the sine wave of the iPhone 5. We see a sine wave that is good, with channels that overlap perfectly and no deviation. This is what we expect to see.
Now for a different example we look at the Nexus 5. Run at maximum volume we see that the left channel is clipping in the sine wave. Likely the power to the headphone amplifier is not enough to drive both channels and so this is the result. UPDATE: Tested this with 4.4.1 and no change.
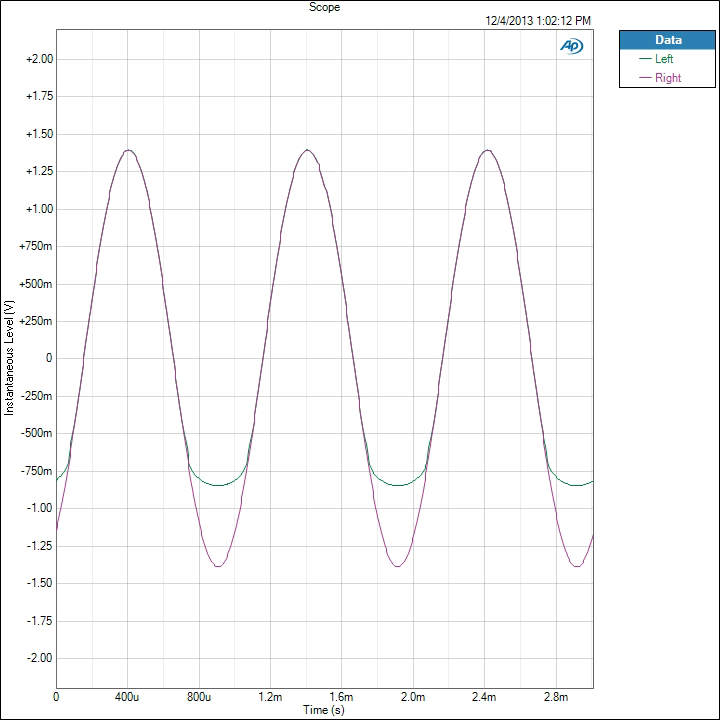
The iPhone 5 produces a THD+N ratio of 0.003134% while because of the clipping, the Nexus 5 is producing 13.789197%. Any level over 1% is considered to be past the clipping point of an amplifier and it seems that the Nexus 5 cannot be driven at maximum volume. I tested two samples to verify, and on both the performance is identical.
Now if we look at the FFT for this test, we see how this distortion is showing up. First, the iPhone 5 is very quiet.
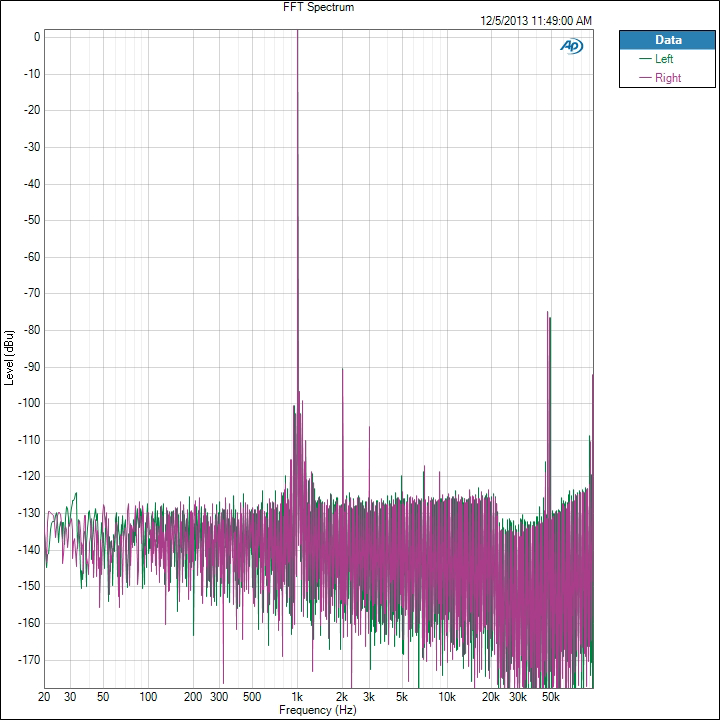
There is a 2 kHz peak that is -93 dB below the fundamental frequency, and the 3rd harmonic at 3 kHz is over -109 dB below it. All the harmonics past that are at -120 dB below the fundamental tone. There is some noise out at 50 kHz but this is so far past the level of human hearing that it is safely ignored. Now the Nexus 5 FFT.
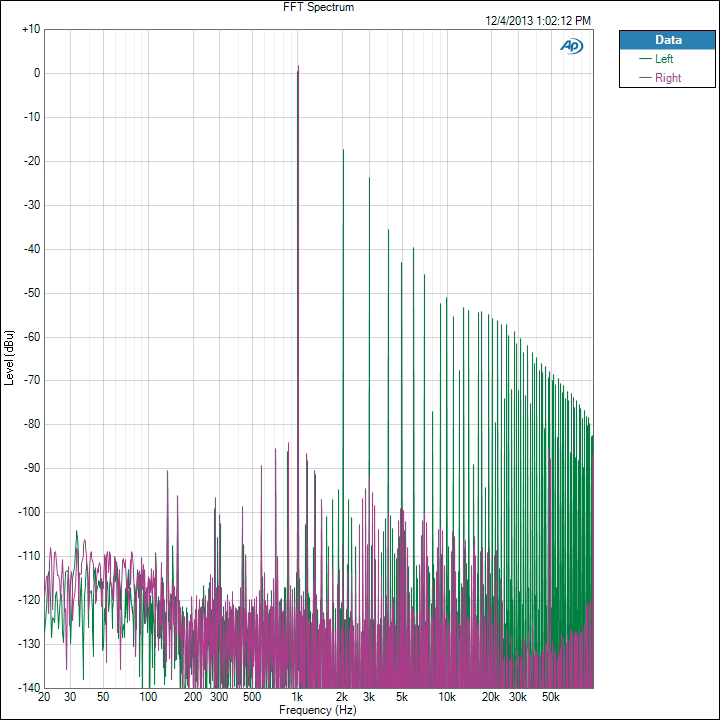
We see the right channel, which didn’t clip, looks good. The 2nd harmonic is -111 dB and the 3rd harmonic is -93 dB. On the left channel the 2nd harmonic is only -18 dB and the 3rd harmonic is -24 dB. Even at the 9th harmonic we are still only -52 dB below the fundamental tone. This is causing these incredibly high THD+N numbers that we are seeing on the Nexus 5. We will see more detail of this on a later test as well.
We also chart THD+N vs. Frequency. Here is the chart for the Note 3.
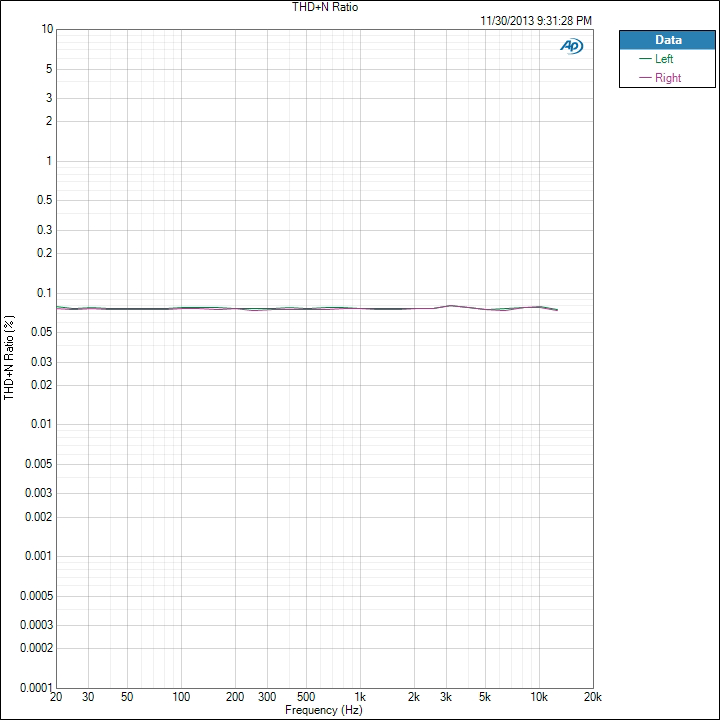
We see that THD+N is basically right below 0.08% for the whole spectrum. It moves up and down slightly, but is very constant. Now here is that Nexus 5 data.
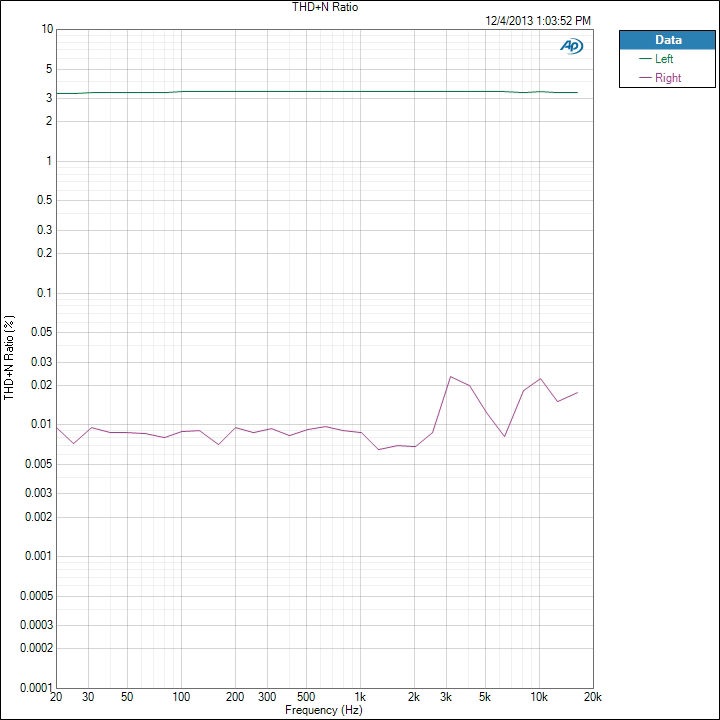
We see that the right channel is around 0.01% THD+N while the left channel, the clipped one, is over 3%. If we ran the Nexus 5 at a lower volume level we would see totally different results, as you’ll find out later, but this is how devices are typically measured.


188 Comments
View All Comments
DanNeely - Sunday, December 8, 2013 - link
I'm curious how well your Grado headphone's are holding up? I bought a pair of SR80's for use at work last winter; but the wire started to develop damage a month or two ago. If I move the wrong way while wearing them I can get brief bursts of static in one ear, and can mute that ear by pinching the cable just above the Y. I suspect the damage was caused by the post in the headband allowing the earcups to spin freely, combined with the unmarked cable making it hard to notice anything less than a half dozen or so revolutions of twist. I'm wondering how much of this is bad luck on my part vs poor design/manufacturing.Marovincian - Monday, December 9, 2013 - link
I had similiar concens with my Grados (actually mine are Allesandro ms1i). I sent grado an email suggesting that they put a stripe on the "Y" wires so that you could more easily straighten them out. They said that they would pass it along to their design team. Then they sent me a free T-Shirt. Classy company for sure.ManuLM - Sunday, December 8, 2013 - link
Quite a good initiative thanks, it is too hard to get these numbers nowadays.I would suggest you guys build up a database over time of phones performance (see headphoneinfo awesome job for instance).
I also suggest that you add to your test the maximum output delivered (power or voltage swing into load). This is interesting, because if a phone clips at high volumes, but its output power is 10dB above the others in average, then the normal user will simply not see the drawback (altough I admit this is initially poor job from the company in tuning the audio system).
It also helps to chase the brands which deliver lower output power, that can turn to a problem on more demanding headphones (high impedance requiring higher voltage swing). Some users will fancy some extra power on their headphone output (even if this might not be safe for their ears).
Last point, some high-end IEMs have quite low impedance, that demand fairly high current specially in the high energy low frequency, creating bass roll off. A simple frequency response check on a low impedance IEM would show this.
RandomUsername3245 - Sunday, December 8, 2013 - link
I like the idea of audio testing, but I am disappointed by the methods used in this article: why would you bother testing a device at maximum volume when you know it is clipping badly? You should reduce the volume to a setting where it does not clip and then continue the review. You can then report the maximum useable volume setting on the device.The maximum volume on an iPhone is reported to be in excess of 100 dB. Listening at this volume for even a short period (15 minutes) on a consistent basis will permanently damage your hearing. Why not test these devices at reasonable volume levels?
http://www.theatlantic.com/health/archive/2011/12/...
(hopefully not too flawed analogy follows...)
If you are comparing two overclocked computers for maximum performance, you set them to their highest stable clock rate and then benchmark. You do not set one to a clock rate that causes continual crashing, and then report that it failed several of the benchmarks. I think this is comparable to audio review for the clipping cellphones. You might argue that the device should support any user-accessible volume level, but historically it is very common for audio amplifiers to allow users to adjust the gain until the output clips. Apple is an unusual case that limits the user to only access non-clipping gain settings.
ManuLM - Sunday, December 8, 2013 - link
audio systems are tested at max performance (there are many reasons for that, including the fact that when you sell something, all usage range of the system should be good), so analogy with OC is not ideal.I agree with you though that testing at nominal volume could help, as an adder only of max volume testing
eio - Monday, December 9, 2013 - link
yes, power of drive is a good factor in a benchmark. but performances at different loads should not be compared directly.eio - Monday, December 9, 2013 - link
a ideal test may have several series of performance graphs with several steps of incrementing loads...RandomUsername3245 - Wednesday, December 11, 2013 - link
Late reply...Like I said in my previous comment, it is common for audio amplifiers to allow you to adjust the gain past where the amplifier will start to clip. You should never expect a car stereo or home theater amplifier to allow you to run at maximum gain without clipping, so why should you expect a phone's headphone amplifier to behave differently?
The proper way to run this test is to adjust the amplifier to maximum non-clipped gain and then run the test.
willis936 - Sunday, December 8, 2013 - link
The day has finally arrived? Good data with some surprising results. I think I'm mostly surprised at how well all of the devices perform. I think dynamic range is perhaps the most important test here simply because most people won't be listening at max volume on headphones and pushing the noise floor down as low as possible is important for quiet listening.Were these tests done on the AKG K701? That is well known as a difficult to drive pair of cans without an amp. If a phone can drive those loudly with good measurements then it's certainly good enough for anything I'd use it for. Testing should be done worst case and if there's time more typical cases. When using my phone as a line out I'll typically leave it 3 steps below max because I expected there to be output stage power issues (seen as dramatic clipping on LG's stuff :x) on my phone. Any lower and as you noted the static noise floor lowers the SNR.
I was a little surprised at the weak channel separation in the otherwise amazing iphone. Channel separation is already a p big issue. Even with expensive headphones it's easy to test and ballpark a crosstalk of worse than -60dB by ear just from the jack to the drivers.
I'd like to make a request for some data of testing devices (1 iphone and 1 iconic android per year?) going backwards to see a progression (or maybe lack thereof) of audio quality in smartphones over the past 4 or 5 years.
willis936 - Sunday, December 8, 2013 - link
Oh, and thanks for the excellent write up and all of your hard work! I'm looking forward to future data.