Smartphone Audio Quality Testing
by Chris Heinonen on December 8, 2013 5:15 PM EST- Posted in
- Smartphones
- Audio
- Mobile
- Tablets
- Testing
THD+N is a measure of the total harmonic distortion and noise compared to the signal. The lower the number, the less distortion and noise there is relative to the fundamental frequency. THD+N is measured by driving a 1 kHz sine wave at maximum volume. Because there is always some inherent background noise, the THD+N is almost always lowest at maximum output so that is used for the measurement.
There are two results that we take from this: a sine wave and a FFT spectrum. On the sine wave both channels should line up perfectly, and it should be as close to an accurate sine wave as possible. On the FFT we want to see a peak at 1 kHz and everything else as low as possible. The most common artifact you will see are harmonic sidebands at multiples of 1 kHz.
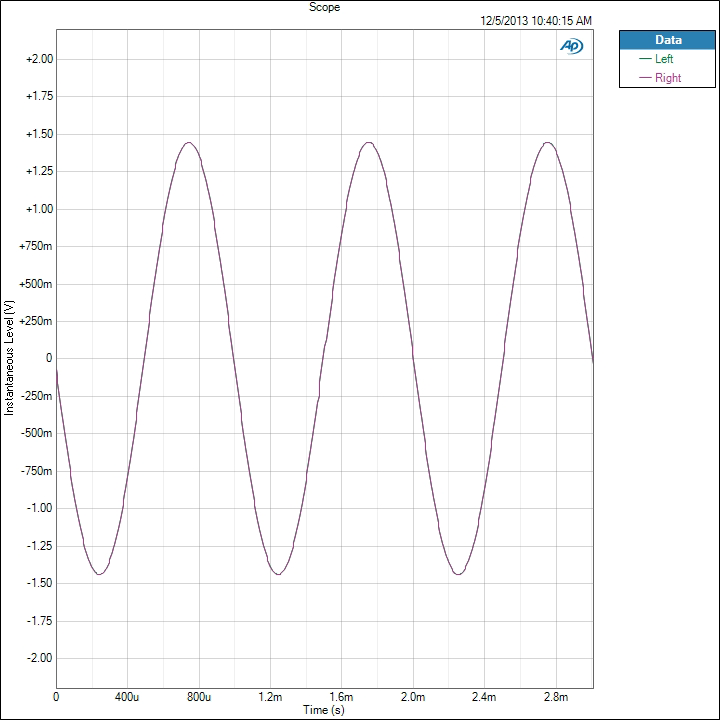
For an example of data that looks good, here is the sine wave of the iPhone 5. We see a sine wave that is good, with channels that overlap perfectly and no deviation. This is what we expect to see.
Now for a different example we look at the Nexus 5. Run at maximum volume we see that the left channel is clipping in the sine wave. Likely the power to the headphone amplifier is not enough to drive both channels and so this is the result. UPDATE: Tested this with 4.4.1 and no change.
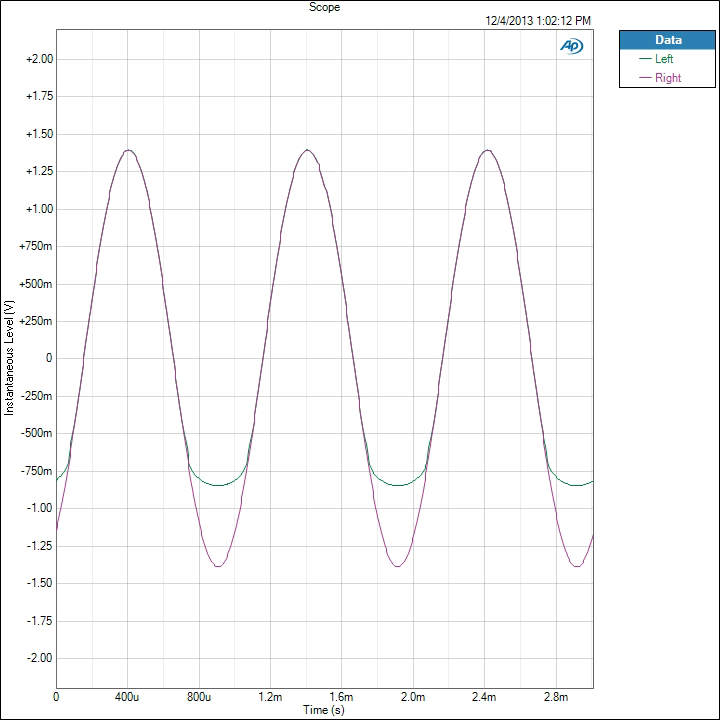
The iPhone 5 produces a THD+N ratio of 0.003134% while because of the clipping, the Nexus 5 is producing 13.789197%. Any level over 1% is considered to be past the clipping point of an amplifier and it seems that the Nexus 5 cannot be driven at maximum volume. I tested two samples to verify, and on both the performance is identical.
Now if we look at the FFT for this test, we see how this distortion is showing up. First, the iPhone 5 is very quiet.
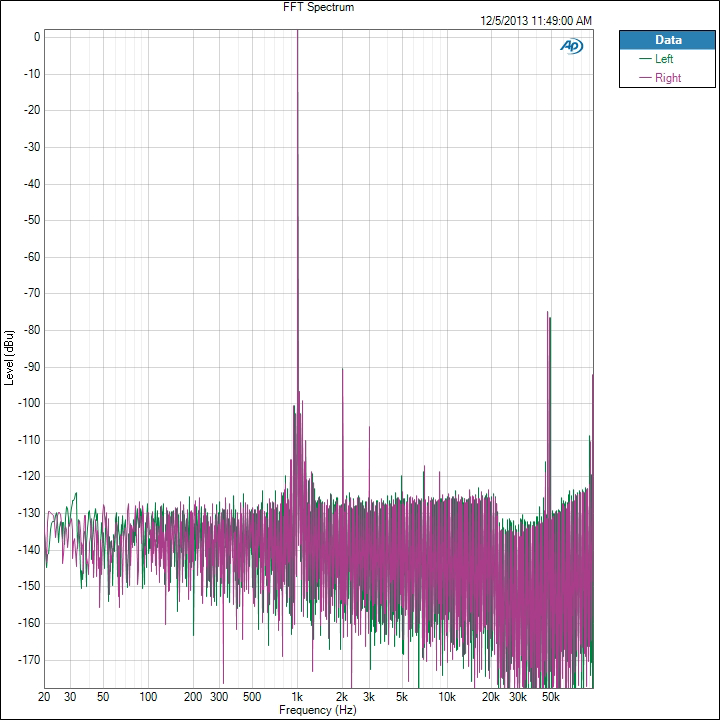
There is a 2 kHz peak that is -93 dB below the fundamental frequency, and the 3rd harmonic at 3 kHz is over -109 dB below it. All the harmonics past that are at -120 dB below the fundamental tone. There is some noise out at 50 kHz but this is so far past the level of human hearing that it is safely ignored. Now the Nexus 5 FFT.
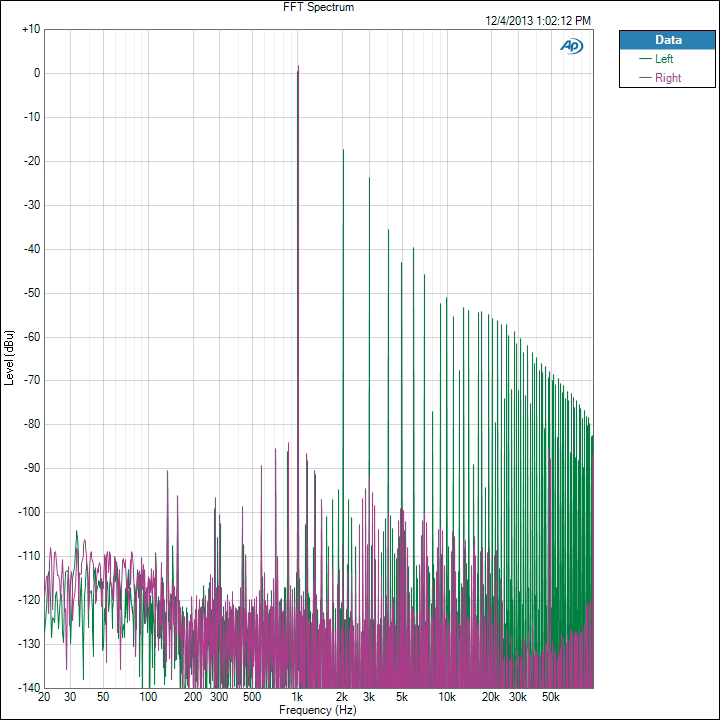
We see the right channel, which didn’t clip, looks good. The 2nd harmonic is -111 dB and the 3rd harmonic is -93 dB. On the left channel the 2nd harmonic is only -18 dB and the 3rd harmonic is -24 dB. Even at the 9th harmonic we are still only -52 dB below the fundamental tone. This is causing these incredibly high THD+N numbers that we are seeing on the Nexus 5. We will see more detail of this on a later test as well.
We also chart THD+N vs. Frequency. Here is the chart for the Note 3.
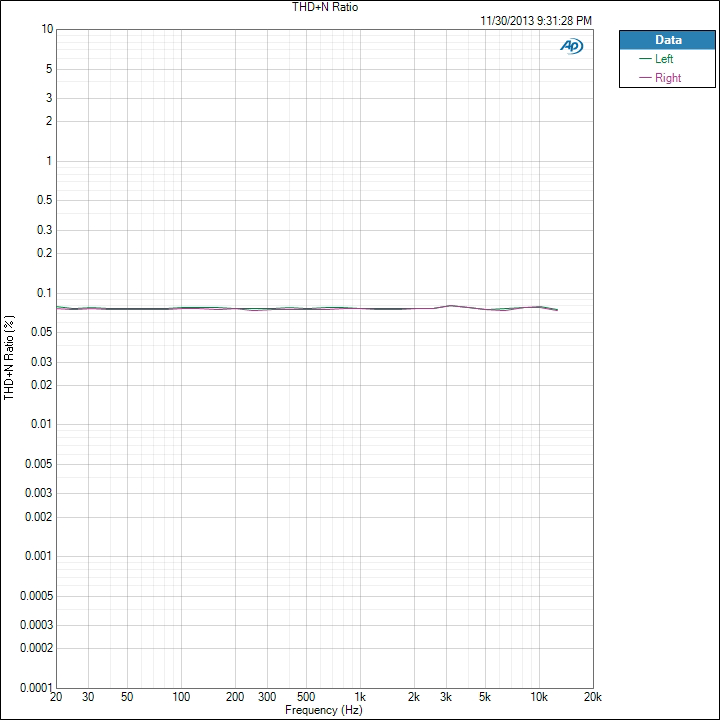
We see that THD+N is basically right below 0.08% for the whole spectrum. It moves up and down slightly, but is very constant. Now here is that Nexus 5 data.
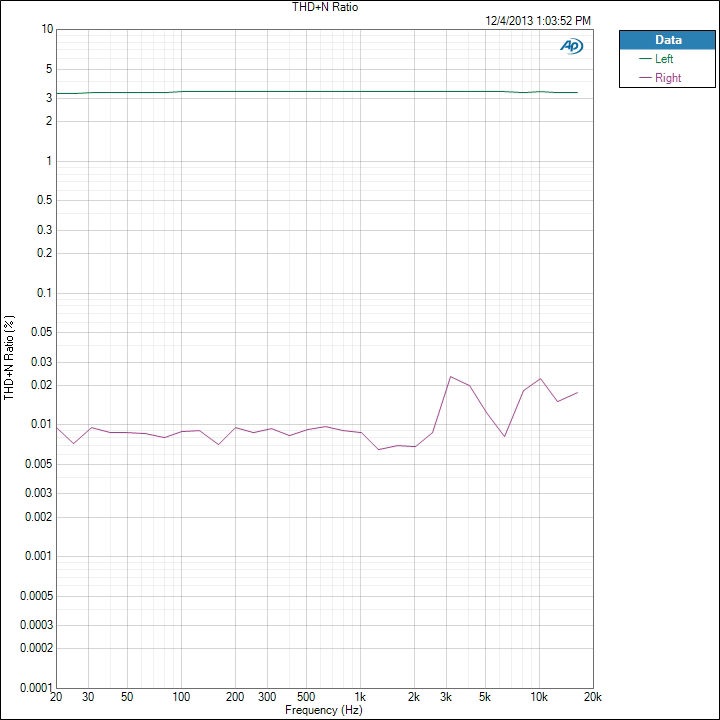
We see that the right channel is around 0.01% THD+N while the left channel, the clipped one, is over 3%. If we ran the Nexus 5 at a lower volume level we would see totally different results, as you’ll find out later, but this is how devices are typically measured.


188 Comments
View All Comments
Impulses - Monday, December 9, 2013 - link
Ehh, impedance curves for the headphones he suggested (Grado SR80, AKG K701) are easy to find (Inner Fidelity and others have decent databases)... Testing and providing output impedance for the phones would be very valuable indeed though, even if everything else in the chain performs alright that alone can affect the FR significantly with one pair of headphones and not at all with the next... And unfortunately there's never been a realistic standard for output impedance, (other than high quality solid state amps now aiming for >1 ohm), and it's often all over the place.ssddaydream - Monday, December 9, 2013 - link
I agree with this.I think of three main usage scenarios regarding the headphone output:
1.) Quality of HP output driving a high-impedance line-level input for a home or car stereo.
2.) Quality of HP output driving low-impedance, sensitive IEMs.
3.) Quality of HP output driving high-impedance, non-sensitive cans.
For #2 and #3, the output impedance should be known, as well as the amplifier power at a given THD level.
There reasons why the iPhones are able to perform well with IEMs, namely low noise floor and low output impedance. Also, iPhones perform well with larger cans because of the decent output power.
I think the usage cases I listed above are pretty common, so I think a good approach to testing is to think about the most important parameters for each usage case.
BTW, I am excited about AT doing these measurements- very good news, indeed!
Anand_user123 - Monday, December 9, 2013 - link
I use my phone most of the time as a music player. Audio quality and storage capacity for flac files are major factors in my buying decision. I hope we can have more widespread information on smartphones audio performancestepz - Monday, December 9, 2013 - link
If you actually cared about scientific measurements of audio performance you would use compressed audio instead of flac. ;) Given a decent amount of bitrate, compressed audio is indistinguishable from uncompressed in double blind tests. In my experience FLAC is mostly about the listener feeling good about getting the "correct" experience, like expensive speaker cables.Impulses - Monday, December 9, 2013 - link
There's a valid usage case for FLAC as far as ripping and archiving IMO, you might as well if you're ripping a large collection (or ripping often)... Since you can quickly re-transcode or edit files w/o a loss of quality... But yeah, I don't see why anyone would put FLAC files on a phone, transcoding is dead simple and super quick if you have a remotely modern PC. Managing FLAC & MP3 playlists or whatever shouldn't be a hurdle if you're putting the effort to maintain a FLAC library to begin with, just use the MP3 library for everything or use stuff like Media Monkey's smart filters/playlists.NaterGator - Monday, December 9, 2013 - link
The biasing of the amplifier in the Nexus 5 and LG G2 left channel appears incorrect. Note it is only clipping on the negative portion of the waveform.vshah - Monday, December 9, 2013 - link
Can't wait to see htc one results!jrs77 - Monday, December 9, 2013 - link
Could you compare the phones to an iPod maybe? This way we would've an comparisooon to a mediaplayer where there's no 3G/4G/LTE disturbance.Oh, and for the general audience discussing the DACs etc... The DAC isn't the cruicial part, never has been. The amp is what it's all about and how good or poor it's powered.
There's a reason why audiophiles still use tube-amps, or atleast digital amps with high quality toroidal transformers and good shielding to reduce noise distortion etc.
Oh, and btw... A good mediaplayer needs a microSDHC-slot or the possibility to use an USB-stick. A mediaplyer is no good if I can't carry my whole music-library with it (100+ GB).
Leezhunjin - Monday, December 9, 2013 - link
Hi Chris, very nice to see smartphones getting measured in terms of audio performance, as many of these phones are used as a music device as well. Personally, I think that an inclusion of output impedance measurements would really great be though, as it is one of the factors that would affect the earphone performance rather significantly.CSMR - Monday, December 9, 2013 - link
Very good start. Poor quality needs to be exposed and you've done this with the Nexus 5.I would like to see output impedance since low output impedance is a very important quality of a good headphone output.