Smartphone Audio Quality Testing
by Chris Heinonen on December 8, 2013 5:15 PM EST- Posted in
- Smartphones
- Audio
- Mobile
- Tablets
- Testing
THD+N is a measure of the total harmonic distortion and noise compared to the signal. The lower the number, the less distortion and noise there is relative to the fundamental frequency. THD+N is measured by driving a 1 kHz sine wave at maximum volume. Because there is always some inherent background noise, the THD+N is almost always lowest at maximum output so that is used for the measurement.
There are two results that we take from this: a sine wave and a FFT spectrum. On the sine wave both channels should line up perfectly, and it should be as close to an accurate sine wave as possible. On the FFT we want to see a peak at 1 kHz and everything else as low as possible. The most common artifact you will see are harmonic sidebands at multiples of 1 kHz.
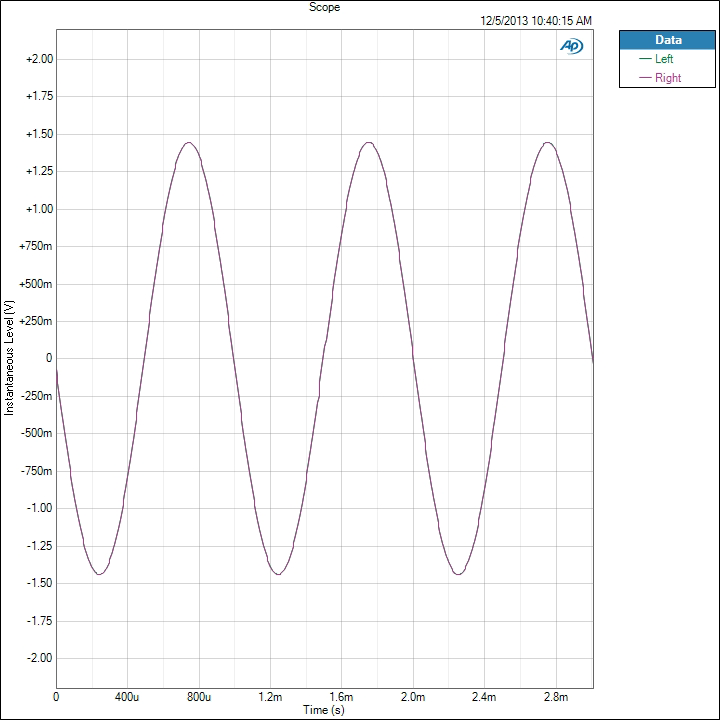
For an example of data that looks good, here is the sine wave of the iPhone 5. We see a sine wave that is good, with channels that overlap perfectly and no deviation. This is what we expect to see.
Now for a different example we look at the Nexus 5. Run at maximum volume we see that the left channel is clipping in the sine wave. Likely the power to the headphone amplifier is not enough to drive both channels and so this is the result. UPDATE: Tested this with 4.4.1 and no change.
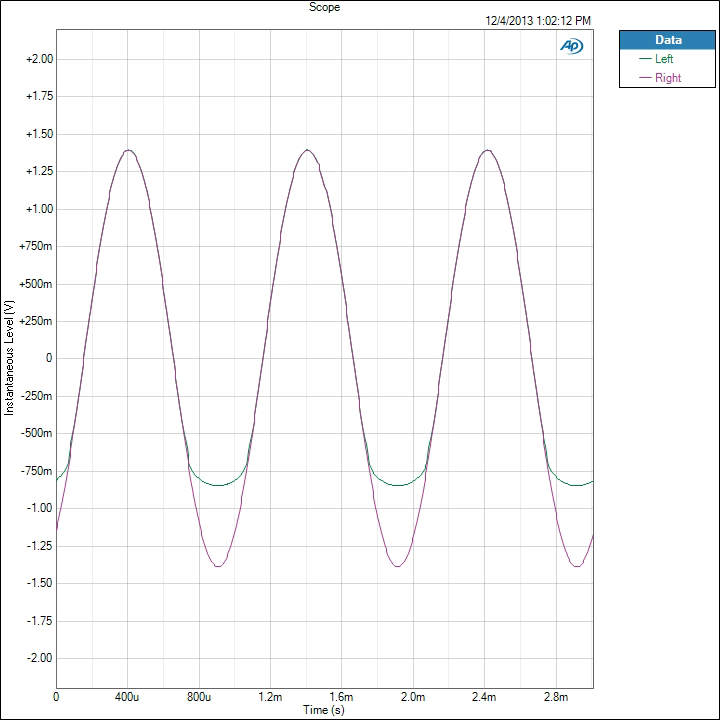
The iPhone 5 produces a THD+N ratio of 0.003134% while because of the clipping, the Nexus 5 is producing 13.789197%. Any level over 1% is considered to be past the clipping point of an amplifier and it seems that the Nexus 5 cannot be driven at maximum volume. I tested two samples to verify, and on both the performance is identical.
Now if we look at the FFT for this test, we see how this distortion is showing up. First, the iPhone 5 is very quiet.
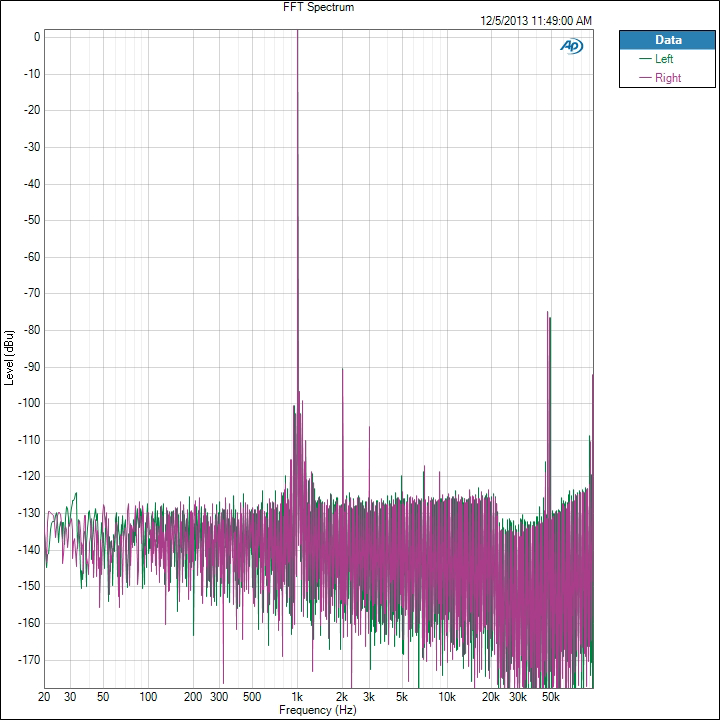
There is a 2 kHz peak that is -93 dB below the fundamental frequency, and the 3rd harmonic at 3 kHz is over -109 dB below it. All the harmonics past that are at -120 dB below the fundamental tone. There is some noise out at 50 kHz but this is so far past the level of human hearing that it is safely ignored. Now the Nexus 5 FFT.
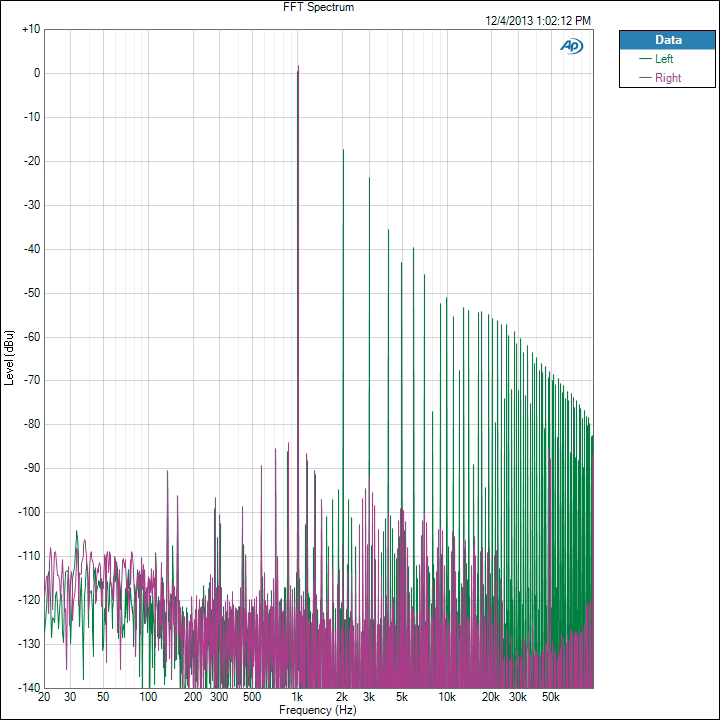
We see the right channel, which didn’t clip, looks good. The 2nd harmonic is -111 dB and the 3rd harmonic is -93 dB. On the left channel the 2nd harmonic is only -18 dB and the 3rd harmonic is -24 dB. Even at the 9th harmonic we are still only -52 dB below the fundamental tone. This is causing these incredibly high THD+N numbers that we are seeing on the Nexus 5. We will see more detail of this on a later test as well.
We also chart THD+N vs. Frequency. Here is the chart for the Note 3.
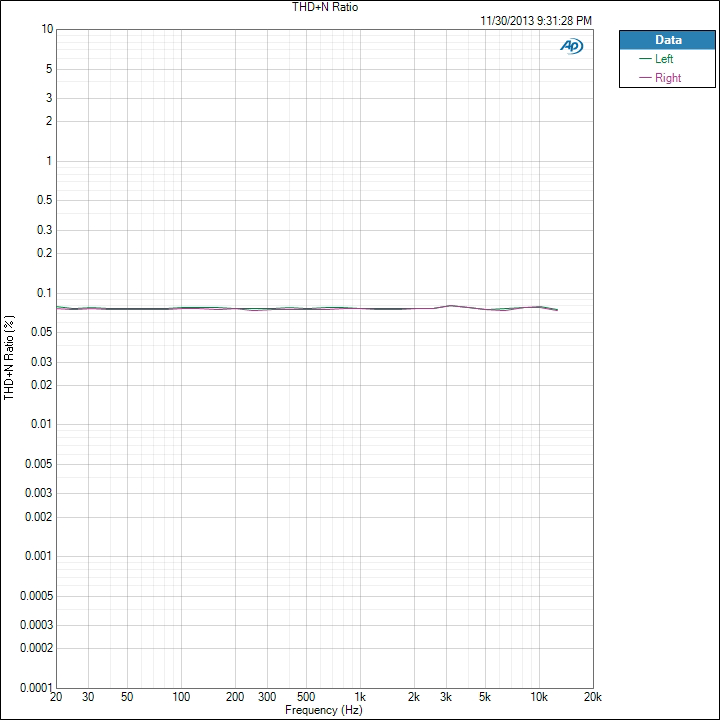
We see that THD+N is basically right below 0.08% for the whole spectrum. It moves up and down slightly, but is very constant. Now here is that Nexus 5 data.
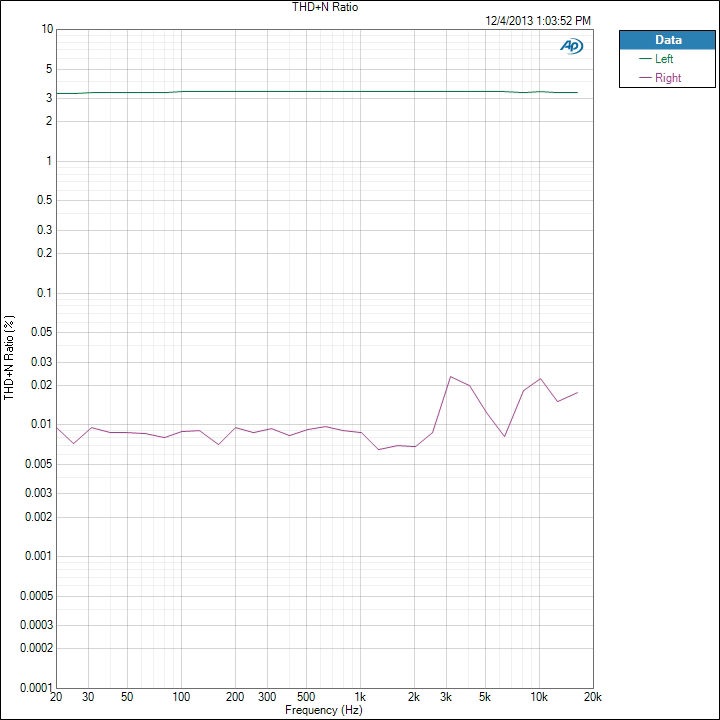
We see that the right channel is around 0.01% THD+N while the left channel, the clipped one, is over 3%. If we ran the Nexus 5 at a lower volume level we would see totally different results, as you’ll find out later, but this is how devices are typically measured.


188 Comments
View All Comments
Impulses - Monday, December 9, 2013 - link
If I didn't say this on one of my previous comments I'll say it now, thanks for doing this! Audio quality is far too often ignored, specially amongst the PC/tech enthusiast crowd... And it's rarely tested very objectively when it's talked about at all.I wouldn't mind some subjective impressions atop the objective testing though... Or even some more commentary on Chris' part regarding the data itself. Knowing the Nexus 5 is clipping at max volume is one thing, but the reader might not necessarily realize it's not an issue at lower volume levels etc.
UpSpin - Monday, December 9, 2013 - link
Great review, I'm looking forward to further tests.A few suggestions:
- Such graphs are nice for a detailed analysis but useless for an easy comparison between different smartphones. Find a way to break down the important information in those graphs to one or two numbers, which you then list in a bar diagram to allow a comparison across different devices.
- As you pointed out yourself and also other commenters, testing THD at the max. volume might be industry standard, but it's useless for a normal consumer, especially, again, in such a comparison. As in the display tests where Anandtech adjusts to a fixed display brightness across all devices, you should do the same here. Because different headphones require different volume settings you might chose three settings:
A really silent one (fixed dB), a normal one (fixed dB), and the loudest possible (max. power the device offers).
For example on my HTC Desire I use Sony in-ear ear-buds which I drive with the lowest volume setting possible, else it's simply too loud for me.
- Those three volumes also have the advantage to go in detail in specific areas:
The loudest volume setting can be used to determine how much load the smartphone can drive and the consequences (just what you did with the Nexus 5, excellent).
The normal volume setting is a measurement for overall audio quality across all devices, because that's the one most people will use. So there a focus should be kept on dynamic range, frequency response, distortion, ...
The silent setting is to determine in detail the background noise. On my HTC Desire noise is audible with the Sony in-ear ear-buds (not with lower end normal ones). And as you said, if the device can output a lot of power, naturally the noise to signal ratio becomes smaller. But that's artificial and a useless measurement when compared to other devices. So keep the volume at a uniform low setting and measure the noise to get comparable and meaningful results across all devices. Also make sure to include some noise measurement while in Airplane mode and while transfering some data over mobile. Then you can judge how well the analog part was designed.
Impulses - Monday, December 9, 2013 - link
Problem is, the dB values Chris would use would often not correspond with the same volume (and power output) level you'd use, because you're using different headphones with different sensitivities. Settling on different power levels might be more correct but it'd probably leave a lot of people scratching their heads... It might be worth taking a looksee at the way Tyll @ InnerFidelity tests amps and headphones. He's been doing objective tests for quite a while and has found a pretty good balance as far as how to present the data in an easy to digest manner.stepz - Monday, December 9, 2013 - link
Having a couple different fixed power output comparison points should make not matching your exact listening volume less of an issue. At least it's a less arbitrary measurement point than the point where the manufacturer decided to put a virtual stopper on the volume knob. The fact that max volume clips with a specific set of headphones shouldn't matter too much. If the headphone amp is clipping due to limited current available then using higher impedance headphones may be able to use that volume level without clipping. And if aren't able to use it, just don't crank it up that high and problem solved.supergex - Monday, December 9, 2013 - link
Finally I waiting for this for years.Simple and probably stupid question, will you include Windows Phone smartphone?
Many thanks in advance for these tests.
Osamede - Monday, December 9, 2013 - link
Is this novel - or just getting up to par? From what I recall, GSMArena and Mobile-Review have been doing detailed measurement of phone audio performance for years.tom5 - Monday, December 9, 2013 - link
I had the HTC One and it played much louder than the G2 without distortions on the same headphones. HTC One is in many ways ahead of newer phones like the G2 or Z1.eio - Monday, December 9, 2013 - link
Bravo! you guys always set the standard of a proper product review.eio - Monday, December 9, 2013 - link
It would be even more great if interference can be benchmarked, like the noise of I/O, communication while playing a quiet music.panda-fu - Monday, December 9, 2013 - link
This is a step in a good direction!However, I don't think the "issue" with the Nexus 5 was explained properly. What is happening is that the volume control on the Nexus goes high enough that it's possible for the amplifier to run out of power against the specific load. This is perfectly normal, and the practical implication is that the maximum power of that headphone amplifier is lower than your published measurements - the result should be at <1% THD.
Also, all results should list the load against which they were measured. If you allow massive amounts of distortion and don't specify a load, it would be easy enough to claim that a 100W <1% THD into 8 Ohms rated amplifier is "discovered to be able to produce 1000W" - just as long as you disregard it being driven into a 2 Ohm load with over 50% THD.
A metric that might also be of use, and practical in predicting a headphone amplifier's real-world performance, is output impedance. Smartphones and tablets are usually used with low impedance, sensitive headphones, and if the output impedance is relatively high, it can affect real-world frequency response massively - sometimes similar in scale as the EQ you pointed out in one of the measurements. Of course, providing measurements made against a range of headphones with different impedance characteristics, as you seem to intend to do, will point at the same issue if there is any. But in that case, please provide impedance curves of the reference headphones.