Choosing a Gaming CPU October 2013: i7-4960X, i5-4670K, Nehalem and Intel Update
by Ian Cutress on October 3, 2013 10:05 AM ESTCPU Benchmarks
Point Calculations - 3D Movement Algorithm Test
The algorithms in 3DPM employ both uniform random number generation or normal distribution random number generation, and vary in various amounts of trigonometric operations, conditional statements, generation and rejection, fused operations, etc. The benchmark runs through six algorithms for a specified number of particles and steps, and calculates the speed of each algorithm, then sums them all for a final score. This is an example of a real world situation that a computational scientist may find themselves in, rather than a pure synthetic benchmark. The benchmark is also parallel between particles simulated, and we test the single thread performance as well as the multi-threaded performance.
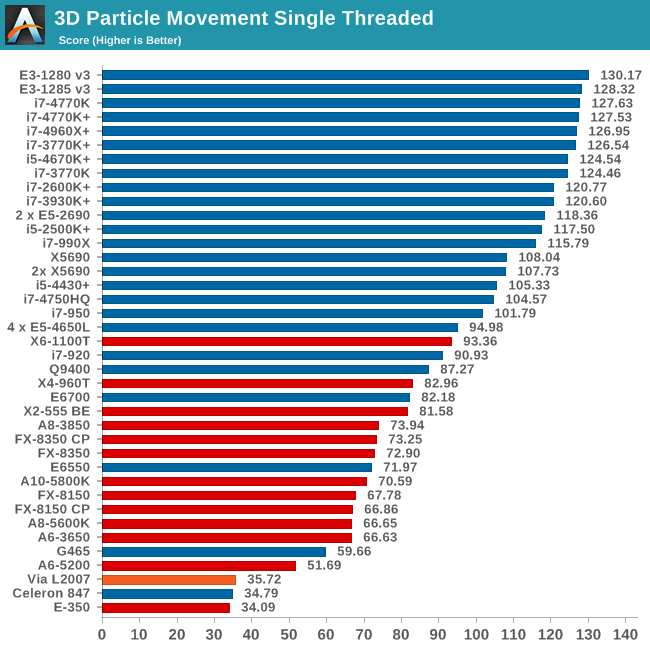
For single thread performance, the higher MHz Haswell CPUs sit on top of the list - interestingly enough it is the Xeons. Comparing these to the i7-4960X, which also sits at 4 GHz, shows the generational difference in this purely multithreaded test. The 100 MHz difference between the i5-4670K and the i7-4770K shows up as two points in this test. The s1366 CPUs are staggered between a score of 90.93 and 115.79, with the i7-920 falling short of the X6-1100T. Due to the IPC difference the i7-990X is behind the i5-2500K and anything older at a similar MHz.
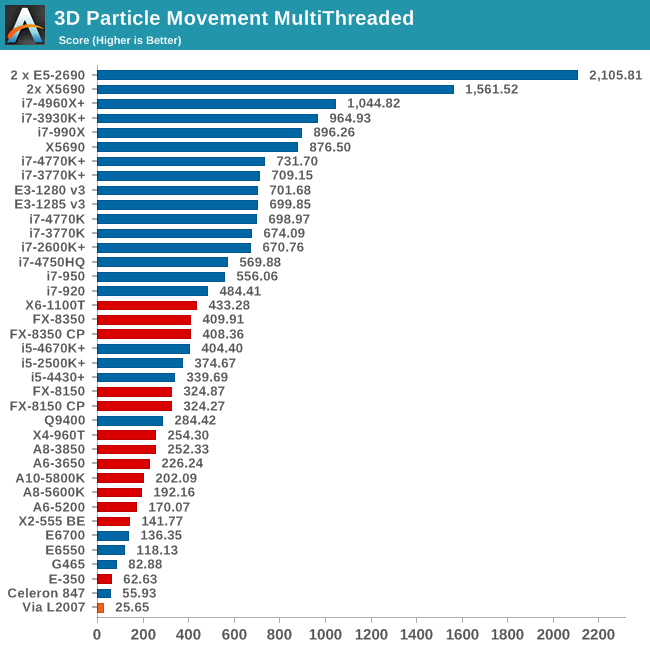
For the multithreaded test, cores and MHz with FP performance win out here, so the i5-4670K, even in a motherboard with Multi-Core Turbo, sits behind the eight threads of the FX-8350 and six threads of the X6-1100T. The i7-4770K scores another 75%, along with the Xeons. In terms of the Nehalem CPUs, the i7-990X performs an extra 200 points higher than the latest Haswell CPUs due to its six core / twelve thread design. Unfortunately the i7-920/i7-950 are a little behind, with the i7-2600K offering a noticable boost.
Compression - WinRAR x64 3.93 + WinRAR 4.2
With 64-bit WinRAR, we compress the set of files used in the USB speed tests. WinRAR x64 3.93 attempts to use multithreading when possible, and provides as a good test for when a system has variable threaded load. WinRAR 4.2 does this a lot better! If a system has multiple speeds to invoke at different loading, the switching between those speeds will determine how well the system will do.
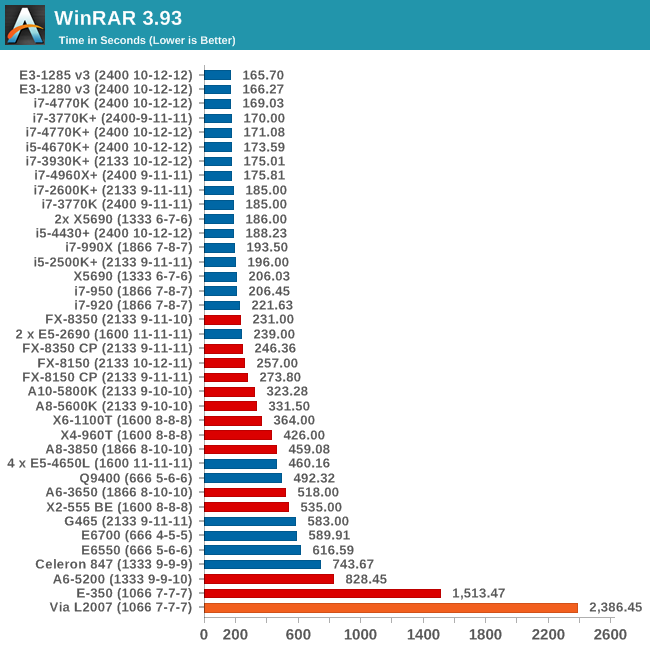
The only downside with WinRAR is that when you're dealing with slow CPUs, they are very slow! The quad core Nehalem CPUs are kept on track by the FX-8350 using this older version of WinRAR, although it seems the higher IPC wins out here over cores with the 4.0 GHz Haswell Xeons scoring best.
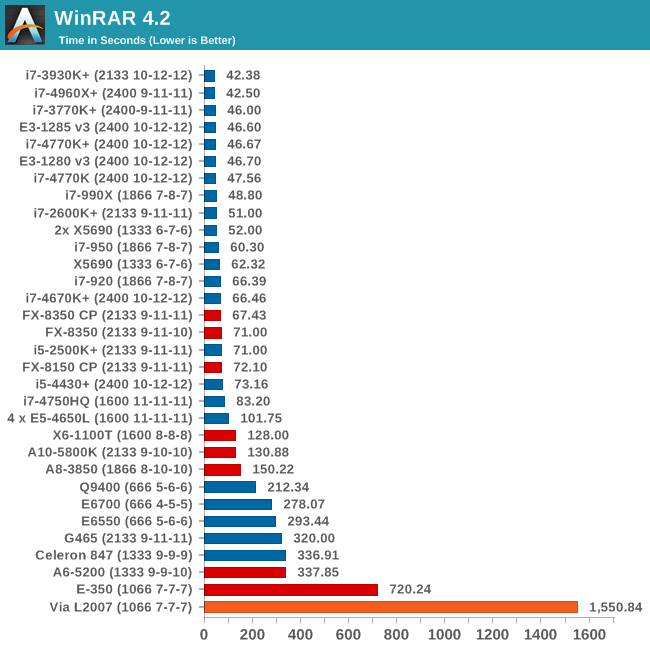
The improvements in WinRAR 4.2 due to optimisations and multi-threading result in more cores giving better results. The i7-990X does well here, although Sandy Bridge-E and Ivy Bridge-E take the top spots. Due to the threading advantage WinRAR takes, the i7-4770K gets a 20 second advantage of its non-hyperthreaded cousin, the i5-4670K.
Image Manipulation - FastStone Image Viewer 4.2
FastStone Image Viewer is a free piece of software I have been using for quite a few years now. It allows quick viewing of flat images, as well as resizing, changing color depth, adding simple text or simple filters. It also has a bulk image conversion tool, which we use here. The software currently operates only in single-thread mode, which should change in later versions of the software. For this test, we convert a series of 170 files, of various resolutions, dimensions and types (of a total size of 163MB), all to the .gif format of 640x480 dimensions.
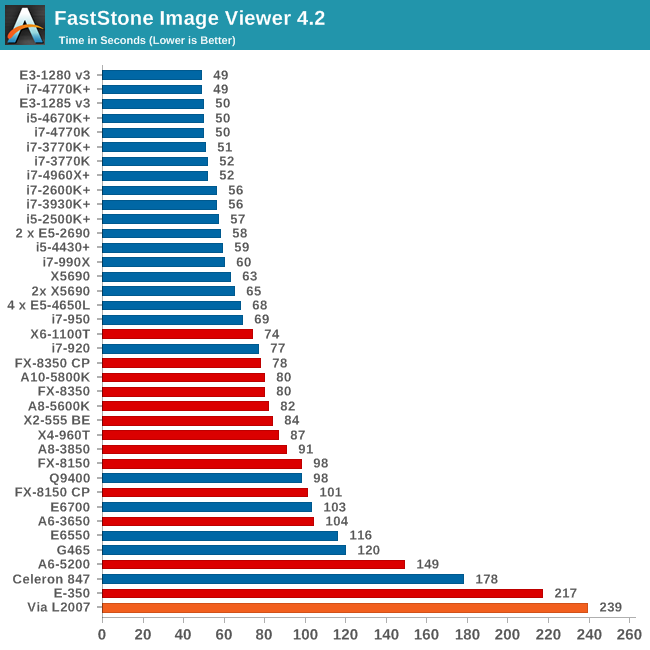
FastStone loves single threaded IPC and MHz, so it's no surprise for the Haswell CPUs to be on top, with no discernable difference between the i5-4670K and the i7-4770K. The old school Nehalems take a knock, with the i7-920 being almost a full 60% slower than the top scores.
Video Conversion - Xilisoft Video Converter 7
With XVC, users can convert any type of normal video to any compatible format for smartphones, tablets and other devices. By default, it uses all available threads on the system, and in the presence of appropriate graphics cards, can utilize CUDA for NVIDIA GPUs as well as AMD WinAPP for AMD GPUs. For this test, we use a set of 33 HD videos, each lasting 30 seconds, and convert them from 1080p to an iPod H.264 video format using just the CPU. The time taken to convert these videos gives us our result.
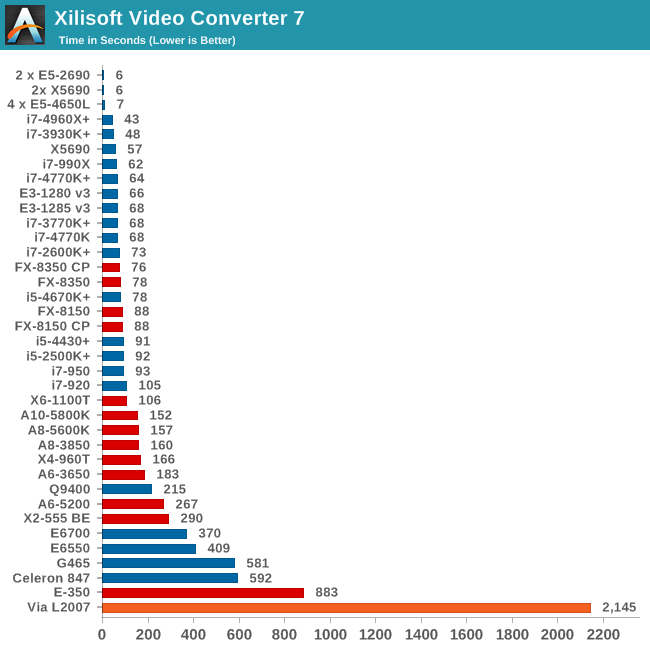
For fully multithreaded video conversion, a combination of cores, IPC and MHz take top spots, hence the i7-4960X is the consumer CPU to get. The i7-990X has a smaller advantage over the quad core Haswells this time, and here is one benchmark where the i5-4670K falls behind the FX-8350s due to the integer nature of the workload. Interestingly enough the i5-4430 slots in with an i5-2500K due to IPC increases despite lower power consumption and MHz.
Rendering – PovRay 3.7
The Persistence of Vision RayTracer, or PovRay, is a freeware package for as the name suggests, ray tracing. It is a pure renderer, rather than modeling software, but the latest beta version contains a handy benchmark for stressing all processing threads on a platform. We have been using this test in motherboard reviews to test memory stability at various CPU speeds to good effect – if it passes the test, the IMC in the CPU is stable for a given CPU speed. As a CPU test, it runs for approximately 2-3 minutes on high end platforms.
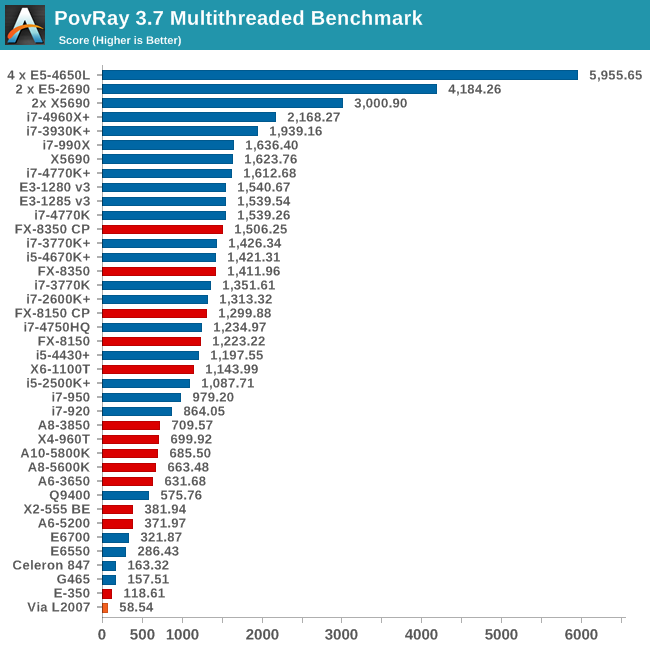
PovRay is another 'multithreading takes all', as shown by our 4P testing on E5-4650L CPUs. The i7-990X still shows its worth, being as quick as the i7-4770K at least, although the i7-920 and i7-950 are further down the pecking order.
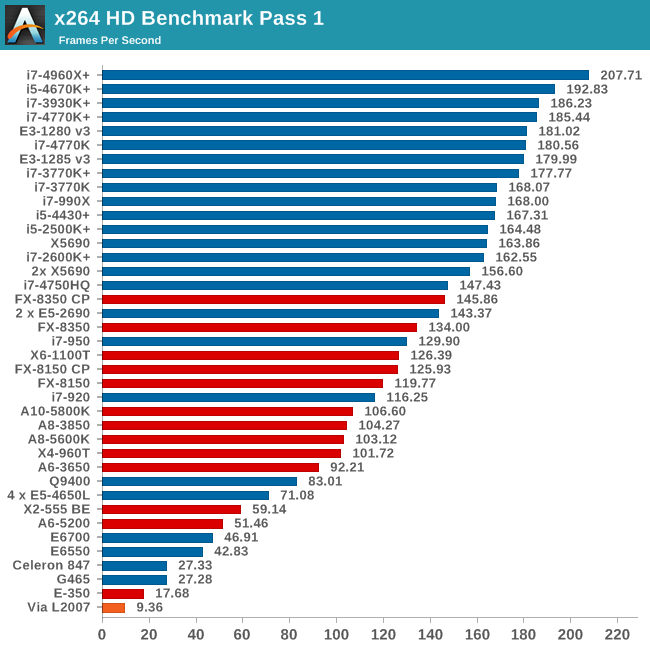
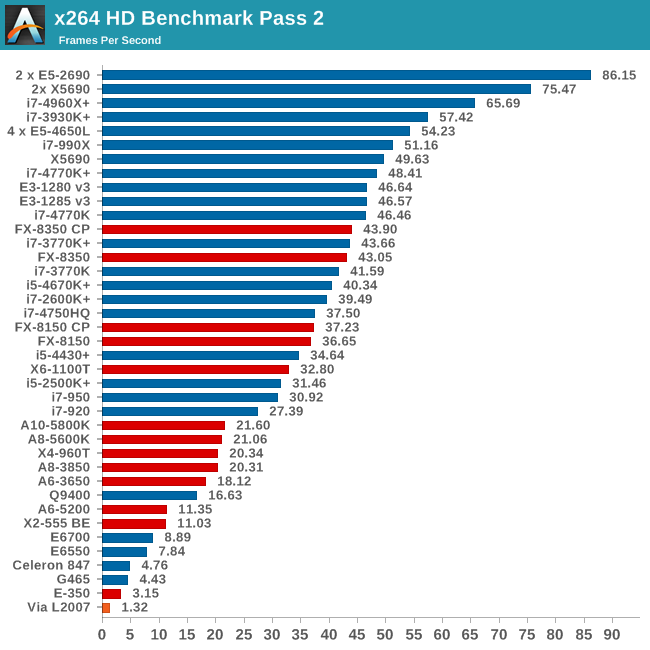
Video Conversion - x264 HD Benchmark
The x264 HD Benchmark uses a common HD encoding tool to process an HD MPEG2 source at 1280x720 at 3963 Kbps. This test represents a standardized result which can be compared across other reviews, and is dependent on both CPU power and memory speed. The benchmark performs a 2-pass encode, and the results shown are the average of each pass performed four times.
Grid Solvers - Explicit Finite Difference
For any grid of regular nodes, the simplest way to calculate the next time step is to use the values of those around it. This makes for easy mathematics and parallel simulation, as each node calculated is only dependent on the previous time step, not the nodes around it on the current calculated time step. By choosing a regular grid, we reduce the levels of memory access required for irregular grids. We test both 2D and 3D explicit finite difference simulations with 2n nodes in each dimension, using OpenMP as the threading operator in single precision. The grid is isotropic and the boundary conditions are sinks. Values are floating point, with memory cache sizes and speeds playing a part in the overall score.
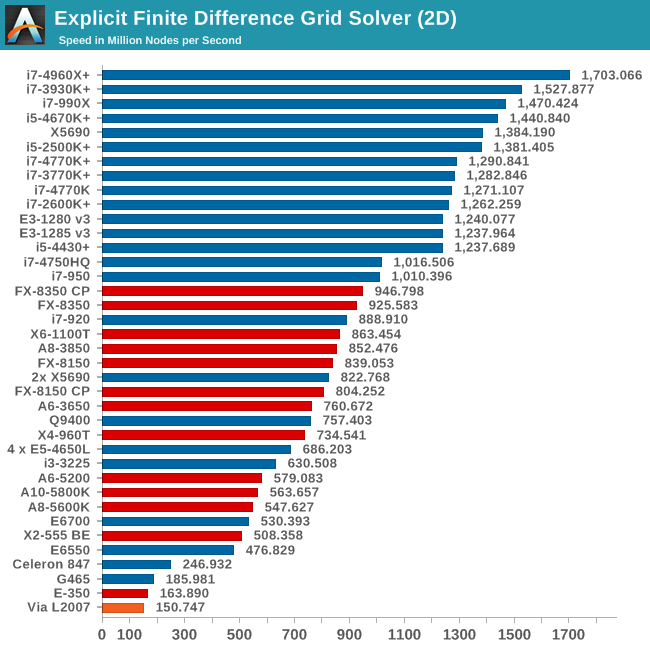
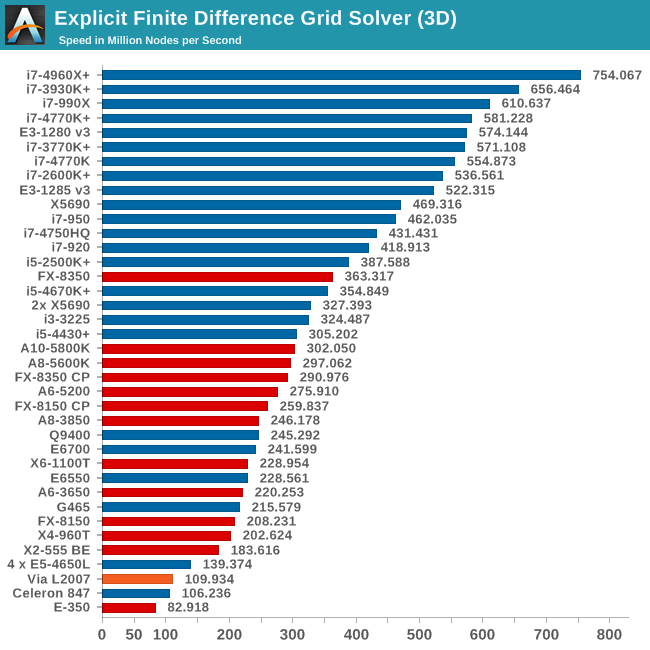
Grid solvers do love a fast processor and plenty of cache in order to store data. When moving up to 3D, it is harder to keep that data within the CPU and spending extra time coding in batches can help throughput. Our simulation takes a very naïve approach in code, using simple operations, but that doesn't stop the single socket, highly threaded CPUs taking top spots. The i5-4670K takes a surprising twist in 2D, outpacing the i7-4770K.
Grid Solvers - Implicit Finite Difference + Alternating Direction Implicit Method
The implicit method takes a different approach to the explicit method – instead of considering one unknown in the new time step to be calculated from known elements in the previous time step, we consider that an old point can influence several new points by way of simultaneous equations. This adds to the complexity of the simulation – the grid of nodes is solved as a series of rows and columns rather than points, reducing the parallel nature of the simulation by a dimension and drastically increasing the memory requirements of each thread. The upside, as noted above, is the less stringent stability rules related to time steps and grid spacing. For this we simulate a 2D grid of 2n nodes in each dimension, using OpenMP in single precision. Again our grid is isotropic with the boundaries acting as sinks. Values are floating point, with memory cache sizes and speeds playing a part in the overall score.
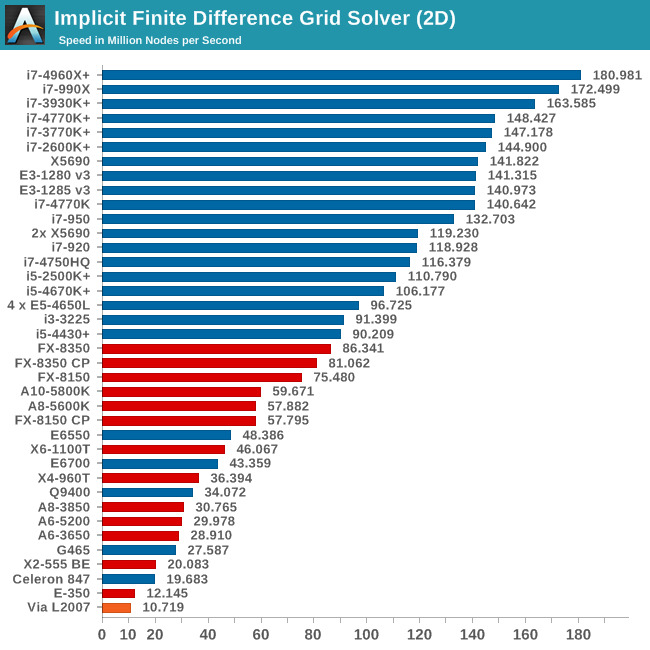
If anything, large caches matter more in implicit simulation, in line with both cores and threads. The i5-4430 is on the lower rungs of the Intel bloc, but the 990X is at the top.
Point Calculations - n-Body Simulation
When a series of heavy mass elements are in space, they interact with each other through the force of gravity. Thus when a star cluster forms, the interaction of every large mass with every other large mass defines the speed at which these elements approach each other. When dealing with millions and billions of stars on such a large scale, the movement of each of these stars can be simulated through the physical theorems that describe the interactions. The benchmark detects whether the processor is SSE2 or SSE4 capable, and implements the relative code. We run a simulation of 10240 particles of equal mass - the output for this code is in terms of GFLOPs, and the result recorded was the peak GFLOPs value.
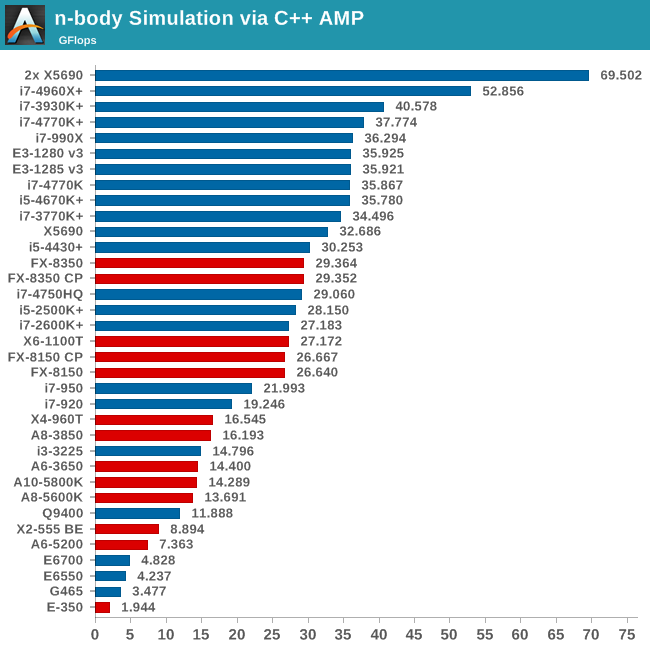
Due to extension enhancements, we see that a quad core Haswell Xeon scores roughly the same as the hex-core Nehalem, with the i5-4430 not far behind. If anything, the i7-920 and i7-950 take a nose dive here, and it's worth investing even in an i5-4430 for a 50% performance enhancement.


137 Comments
View All Comments
tackle70 - Thursday, October 3, 2013 - link
The 8350 is with the 2600k, not the 3930k...So yeah, it's a very good showing for AMD, but not as good as what you indicate. Also, according to sweclockers, an overclocked i5 is still superior to an overclocked 83xx CPU, so make of that what you wish.
I'm just glad we're seeing games starting to use more than 2-4 threads effectively.
Traciatim - Thursday, October 3, 2013 - link
Much more likely is that games will just become less and less reliant on CPU power because of the terrible netbook processors in the consoles and will instead rely more and more on the GPU. The PC versions of games will just be the same game with a high res texture pack and some extra graphics bling to use up GPU cycles while your processor sits around shuffling a little data.Flunk - Friday, October 4, 2013 - link
I'm not sure AMD will benefit that much. As soon as consumer CPUs have a reason to have more cores they're just release a new chip with more cores. There is absolutely no reason that they can't release a 8 or ever 12 core desktop processor, they're already selling them for servers.Flunk - Friday, October 4, 2013 - link
Forgot to mention, Watch Dogs is probably x64 only because they want to use more than 2GB of RAM (which is the limit for the user-mode memory partition in Win32).Nirvanaosc - Thursday, October 3, 2013 - link
Looking just at the gaming results, does this means that almost any CPU is capable to feed the GPU at 1440p and it is always GPU limited?Nirvanaosc - Thursday, October 3, 2013 - link
I mean in single GPU config.Traciatim - Thursday, October 3, 2013 - link
That's pretty much just the games they picked. If you could reliably benchmark large scale PC games like Planetside 2, or other popular large scale MMO's reliably you'd pretty much see the exact opposite. The trouble is, it seems like no MMO makers give you reliable benchmarking tools so you can't use them for tests like these.ryccoh - Thursday, October 3, 2013 - link
I would really like to see a CPU comparison for strategy games.For example, one could have a save game of a far advanced game in Civilization 5 or Total War with many AI players on the largest map and then see how the waiting time varies between the different CPUs. This should be feasible, shouldn't it?
I'm running an i5 2500k @4.6ghz and it just isn't cutting it for Civilization 5 on a large map once you're far into the game, it would be nice to see whether getting hyperthreading and more cores would be worth it.
glugglug - Thursday, October 3, 2013 - link
Having waited the ridiculous amounts of time between turns on Civ V, and having dual monitors, I put task manager up on the second monitor while it was running, to see that Civ V *IS NOT MULTITHREADED. AT ALL*. Setting the CPU affinity to make it use only 1 logical core makes absolutely no performance difference at all! The only thing I can think of for why a better result would be seen on quad-core systems would be that it likes having a larger L3 cache.glugglug - Thursday, October 3, 2013 - link
P.S. If my "Civ V just likes cache" theory is right, an Iris Pro laptop should be the ultimate Civ V machine.