Samsung SSD 840 EVO Review: 120GB, 250GB, 500GB, 750GB & 1TB Models Tested
by Anand Lal Shimpi on July 25, 2013 1:53 PM EST- Posted in
- Storage
- SSDs
- Samsung
- TLC
- Samsung SSD 840
AnandTech Storage Bench 2011
Two years ago we introduced our AnandTech Storage Bench, a suite of benchmarks that took traces of real OS/application usage and played them back in a repeatable manner. I assembled the traces myself out of frustration with the majority of what we have today in terms of SSD benchmarks.
Although the AnandTech Storage Bench tests did a good job of characterizing SSD performance, they weren't stressful enough. All of the tests performed less than 10GB of reads/writes and typically involved only 4GB of writes specifically. That's not even enough exceed the spare area on most SSDs. Most canned SSD benchmarks don't even come close to writing a single gigabyte of data, but that doesn't mean that simply writing 4GB is acceptable.
Originally I kept the benchmarks short enough that they wouldn't be a burden to run (~30 minutes) but long enough that they were representative of what a power user might do with their system.
Not too long ago I tweeted that I had created what I referred to as the Mother of All SSD Benchmarks (MOASB). Rather than only writing 4GB of data to the drive, this benchmark writes 106.32GB. It's the load you'd put on a drive after nearly two weeks of constant usage. And it takes a *long* time to run.
1) The MOASB, officially called AnandTech Storage Bench 2011 - Heavy Workload, mainly focuses on the times when your I/O activity is the highest. There is a lot of downloading and application installing that happens during the course of this test. My thinking was that it's during application installs, file copies, downloading and multitasking with all of this that you can really notice performance differences between drives.
2) I tried to cover as many bases as possible with the software I incorporated into this test. There's a lot of photo editing in Photoshop, HTML editing in Dreamweaver, web browsing, game playing/level loading (Starcraft II & WoW are both a part of the test) as well as general use stuff (application installing, virus scanning). I included a large amount of email downloading, document creation and editing as well. To top it all off I even use Visual Studio 2008 to build Chromium during the test.
The test has 2,168,893 read operations and 1,783,447 write operations. The IO breakdown is as follows:
| AnandTech Storage Bench 2011 - Heavy Workload IO Breakdown | ||||
| IO Size | % of Total | |||
| 4KB | 28% | |||
| 16KB | 10% | |||
| 32KB | 10% | |||
| 64KB | 4% | |||
Only 42% of all operations are sequential, the rest range from pseudo to fully random (with most falling in the pseudo-random category). Average queue depth is 4.625 IOs, with 59% of operations taking place in an IO queue of 1.
Many of you have asked for a better way to really characterize performance. Simply looking at IOPS doesn't really say much. As a result I'm going to be presenting Storage Bench 2011 data in a slightly different way. We'll have performance represented as Average MB/s, with higher numbers being better. At the same time I'll be reporting how long the SSD was busy while running this test. These disk busy graphs will show you exactly how much time was shaved off by using a faster drive vs. a slower one during the course of this test. Finally, I will also break out performance into reads, writes and combined. The reason I do this is to help balance out the fact that this test is unusually write intensive, which can often hide the benefits of a drive with good read performance.
There's also a new light workload for 2011. This is a far more reasonable, typical every day use case benchmark. Lots of web browsing, photo editing (but with a greater focus on photo consumption), video playback as well as some application installs and gaming. This test isn't nearly as write intensive as the MOASB but it's still multiple times more write intensive than what we were running in 2010.
As always I don't believe that these two benchmarks alone are enough to characterize the performance of a drive, but hopefully along with the rest of our tests they will help provide a better idea.
The testbed for Storage Bench 2011 has changed as well. We're now using a Sandy Bridge platform with full 6Gbps support for these tests.
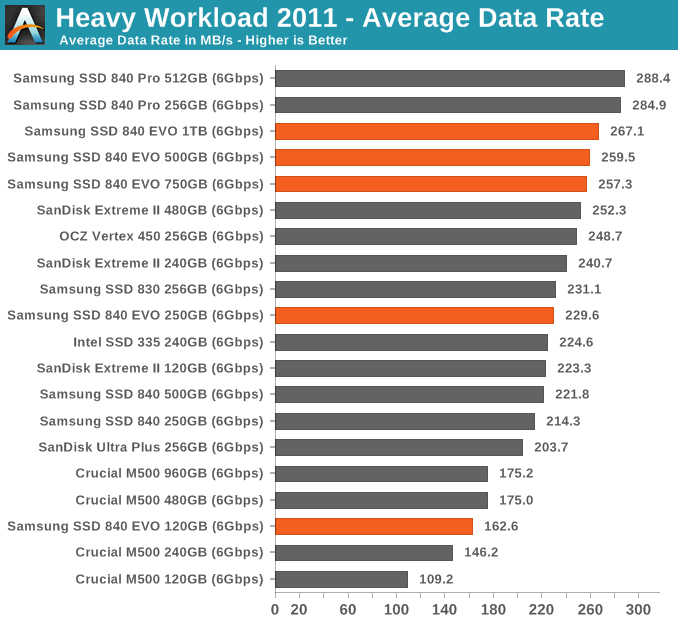
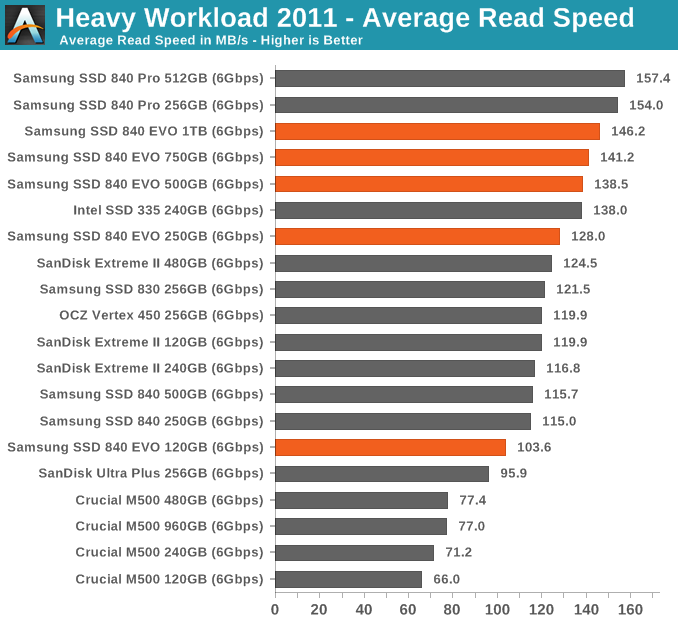
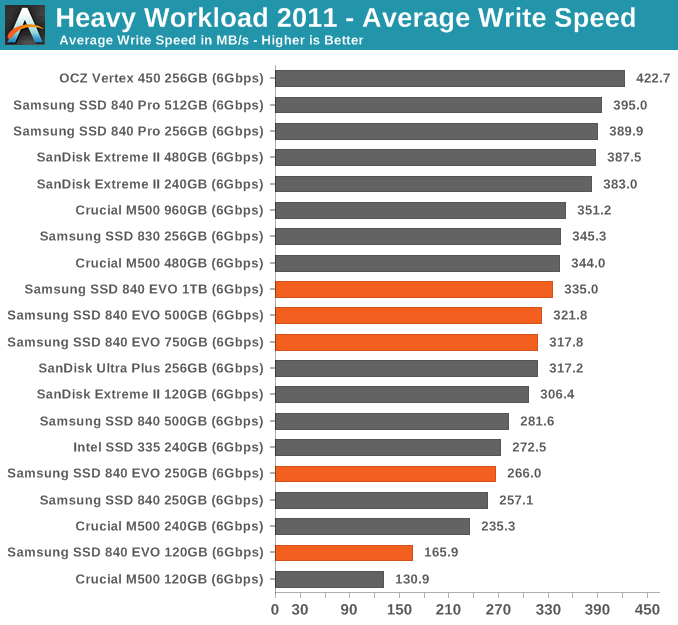
AnandTech Storage Bench 2011 - Heavy Workload
We'll start out by looking at average data rate throughout our new heavy workload test:
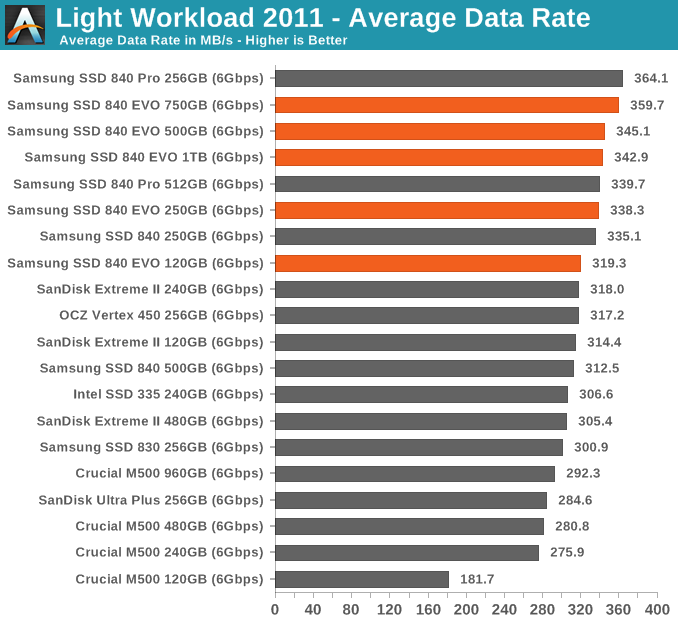
In lighter workloads than our 2013 workload the EVO still does incredibly well.
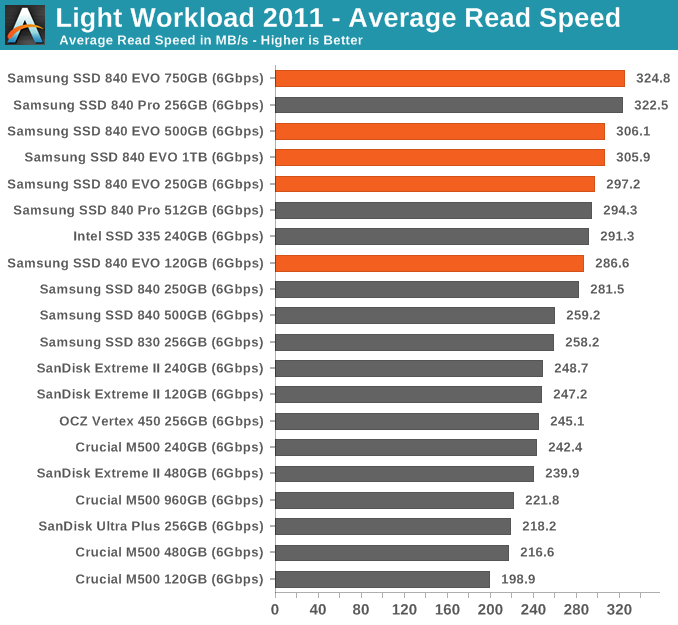
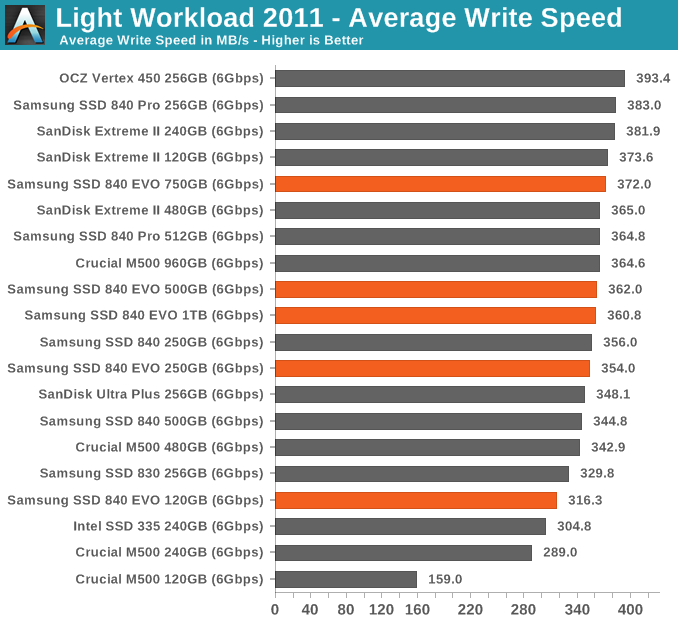
AnandTech Storage Bench 2011 - Light Workload
Our new light workload actually has more write operations than read operations. The split is as follows: 372,630 reads and 459,709 writes. The relatively close read/write ratio does better mimic a typical light workload (although even lighter workloads would be far more read centric).
The I/O breakdown is similar to the heavy workload at small IOs, however you'll notice that there are far fewer large IO transfers:
| AnandTech Storage Bench 2011 - Light Workload IO Breakdown | ||||
| IO Size | % of Total | |||
| 4KB | 27% | |||
| 16KB | 8% | |||
| 32KB | 6% | |||
| 64KB | 5% | |||


137 Comments
View All Comments
Grim0013 - Sunday, July 28, 2013 - link
I wonder what, if anything, the impact of Turbo Write is on drive endurance, as in, does the SLC buffer have the effect of "shielding" the TLC from some amount of write amplification (WA)? More specifically, I was thinking that in the case of small random writes (high WA), many of them would be going to the SLC first, then when the data is transferred to the TLC, I wonder if the buffering affords the controller the opportunity to write the data is such a way as to reduce WA on the TLC?In fact, I wonder if that is something that is done...if the controller is able to characterize certain types of files as being likely the be frequently modified then just keep them in the SLC semi-permanently. Stuff like the page file and other OS stuff that is constantly modified...I'm not very well-versed on this stuff so I'm just guessing. It just seems like taking advantage of SLCs crazy p/e endurance in addition to it's speed could really help make these things bulletproof.
shodanshok - Sunday, July 28, 2013 - link
Yea, I was thinking the same thing. After all, Sandisk already did it on the Ultra Plus and Ultra II SSDs: they have a small pseudo-SLC zone used both for greater performance and reducing WA.shodanshok - Sunday, July 28, 2013 - link
I am not so exited about RAPID: data integrity is a delicate thing, so I am not so happy to trust Samsung (or others) replacing the key well-tested caching algorithm natively built into the OS.Anyway, Windows' write caching is not so quick because the OS, by default, flush its in-memory cache each second. Moreover, it normally issue a barrier event to flush the disk's DRAM cache. This last thing can be disabled, but the flush of the in-memory cache can not be changed, as far I know.
Linux, on the other side, use much aggressive caching policy: it issue an in-memory cache flush (pagecache) ever 30 seconds, and it aggressively try to coalesce multiple writes into a single transactions. This parameter is configurable using the /proc interface. Moreover, if you have a BBU or power-tolerant disk subsystem, you can even disable the barrier instruction normally issued to the disk's DRAM cache.
Timur Born - Sunday, July 28, 2013 - link
My Windows 8 setup uses quite exactly 1 gb RAM for write caching, regardless of whether it's writing to a 5400 rpm 2.5" HD, 5400 rpm 3.5" HD or Crucial M4 256 gb SSD. That's exactly the size of the RAPID cache. The "flush its cache each second" part becomes a problem when the source and destination are on the same drive, because once Windows starts writing the disk queue starts to climb.But even then it should mostly be a problem for spinning HDs that don't really like higher queue numbers. Even more so when you copy multiple files via Windows Explorer, which reads and write files concurrently even on spinning HDs.
So I wonder if RAPID's only real advantage is its feature to coalesce multiple small writes into single big ones for durations longer than one second?!
Timur Born - Sunday, July 28, 2013 - link
By the way, my personal experience is that CPU power saving features, as set up in both in the default "Balanced" and the "High Performance" power-profiles, have far more of an impact on SSD performance than caching stuff. I can up my M4' 4K random performance by 60% and more just by messing with CPU power savings to be less aggressive (or off).shodanshok - Monday, July 29, 2013 - link
If I correctly remember, Windows use at most 1/8 of total RAM size for write caching. How much RAM did you have?Timur Born - Tuesday, July 30, 2013 - link
8 gb, so you may be correct. Or you may mix it up with the 1/8 part of dirty cache that is being flushed by the Windows cache every second. Or both may be 1/8. ;-)zzz777 - Monday, July 29, 2013 - link
I'm interested in caching writes to a ram disk then to storage. This reminds me if the concept of a write-back cache: for almost everyone The possibility of data corruption is so low that there's no reason not to enable it: can this ssd ramdisk write quickly enough that home users also don't have to worry about using it? Beyond that I'm not a normal home user, I want to see benchmarks for virtualization, I want the quickest way to create, modify and test a vm before putting it on front life hardwareWwhat - Monday, July 29, 2013 - link
I for me still say: I rather go for the pro version.andreaciri - Thursday, August 1, 2013 - link
i have to decide if buy an 840 now, or an EVO when it will be available, for my macbook. considering that RAPID technology is only supported under windows, and that i'm more interested in read performance than write, is 840 a good choice?