The Seagate 600 & 600 Pro SSD Review
by Anand Lal Shimpi on May 7, 2013 8:00 AM ESTAnandTech Storage Bench 2011
Two years ago we introduced our AnandTech Storage Bench, a suite of benchmarks that took traces of real OS/application usage and played them back in a repeatable manner. I assembled the traces myself out of frustration with the majority of what we have today in terms of SSD benchmarks.
Although the AnandTech Storage Bench tests did a good job of characterizing SSD performance, they weren't stressful enough. All of the tests performed less than 10GB of reads/writes and typically involved only 4GB of writes specifically. That's not even enough exceed the spare area on most SSDs. Most canned SSD benchmarks don't even come close to writing a single gigabyte of data, but that doesn't mean that simply writing 4GB is acceptable.
Originally I kept the benchmarks short enough that they wouldn't be a burden to run (~30 minutes) but long enough that they were representative of what a power user might do with their system.
Not too long ago I tweeted that I had created what I referred to as the Mother of All SSD Benchmarks (MOASB). Rather than only writing 4GB of data to the drive, this benchmark writes 106.32GB. It's the load you'd put on a drive after nearly two weeks of constant usage. And it takes a *long* time to run.
1) The MOASB, officially called AnandTech Storage Bench 2011 - Heavy Workload, mainly focuses on the times when your I/O activity is the highest. There is a lot of downloading and application installing that happens during the course of this test. My thinking was that it's during application installs, file copies, downloading and multitasking with all of this that you can really notice performance differences between drives.
2) I tried to cover as many bases as possible with the software I incorporated into this test. There's a lot of photo editing in Photoshop, HTML editing in Dreamweaver, web browsing, game playing/level loading (Starcraft II & WoW are both a part of the test) as well as general use stuff (application installing, virus scanning). I included a large amount of email downloading, document creation and editing as well. To top it all off I even use Visual Studio 2008 to build Chromium during the test.
The test has 2,168,893 read operations and 1,783,447 write operations. The IO breakdown is as follows:
| AnandTech Storage Bench 2011 - Heavy Workload IO Breakdown | ||||
| IO Size | % of Total | |||
| 4KB | 28% | |||
| 16KB | 10% | |||
| 32KB | 10% | |||
| 64KB | 4% | |||
Only 42% of all operations are sequential, the rest range from pseudo to fully random (with most falling in the pseudo-random category). Average queue depth is 4.625 IOs, with 59% of operations taking place in an IO queue of 1.
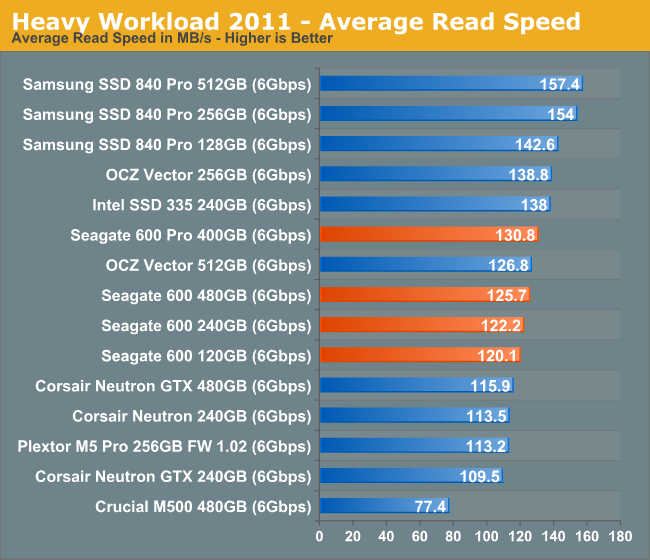
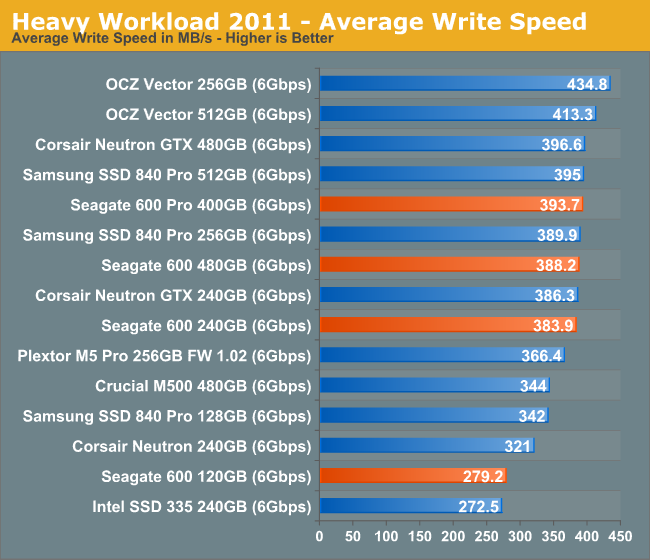
Many of you have asked for a better way to really characterize performance. Simply looking at IOPS doesn't really say much. As a result I'm going to be presenting Storage Bench 2011 data in a slightly different way. We'll have performance represented as Average MB/s, with higher numbers being better. At the same time I'll be reporting how long the SSD was busy while running this test. These disk busy graphs will show you exactly how much time was shaved off by using a faster drive vs. a slower one during the course of this test. Finally, I will also break out performance into reads, writes and combined. The reason I do this is to help balance out the fact that this test is unusually write intensive, which can often hide the benefits of a drive with good read performance.
There's also a new light workload for 2011. This is a far more reasonable, typical every day use case benchmark. Lots of web browsing, photo editing (but with a greater focus on photo consumption), video playback as well as some application installs and gaming. This test isn't nearly as write intensive as the MOASB but it's still multiple times more write intensive than what we were running in 2010.
As always I don't believe that these two benchmarks alone are enough to characterize the performance of a drive, but hopefully along with the rest of our tests they will help provide a better idea.
The testbed for Storage Bench 2011 has changed as well. We're now using a Sandy Bridge platform with full 6Gbps support for these tests.
AnandTech Storage Bench 2011 - Heavy Workload
We'll start out by looking at average data rate throughout our new heavy workload test:
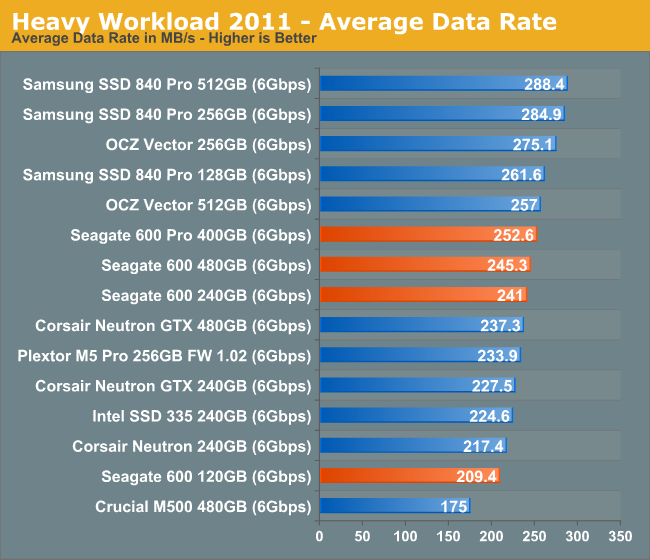
Seagate's 600 does reasonably well here, but if you don't take into account IO consistency then the 600/600 Pro are still behind Samsung's SSD 840 Pro.
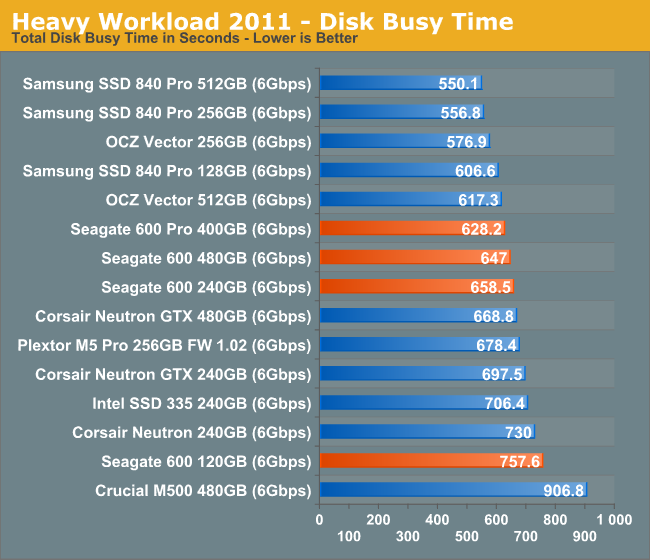
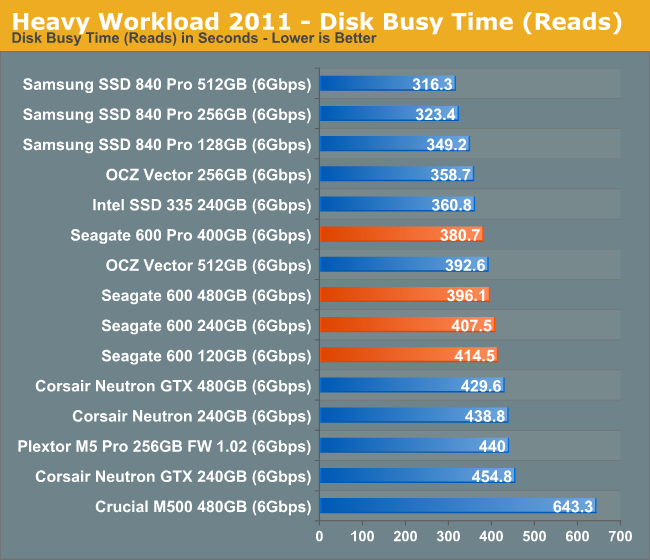
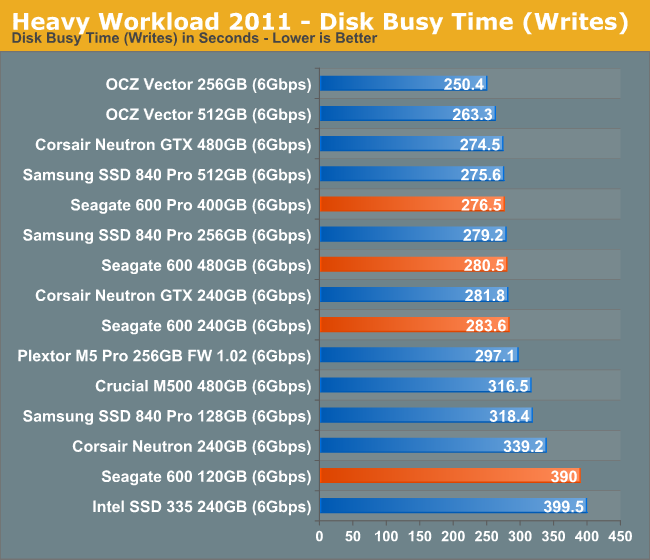
The next three charts just represent the same data, but in a different manner. Instead of looking at average data rate, we're looking at how long the disk was busy for during this entire test. Note that disk busy time excludes any and all idles, this is just how long the SSD was busy doing something:


59 Comments
View All Comments
Jestre - Tuesday, May 7, 2013 - link
2 requests:Can you incorporate the average power usage measured during the testing benchmarks, both "the Destroyer" and the 2011 benchmarks?
It would be nice to see the actual realistic measured power consumption averages for worst case tests like this. You could also list an average power with a reasonable downtime calculated based on a typical usage pattern and the actual time to complete.
Can you also list the time is take to complete these test for each drive,
Thanks for all you good work.
Jestre
Kristian Vättö - Tuesday, May 7, 2013 - link
At least I don't have the hardware for measuring power consumption over time (all I have is a simple multimeter, unless it has features I'm not aware of). Anand might but I'm guessing not as I'm sure he would have taken advantage of it. The problem is that such hardware is not exactly cheap, so it's a rather big investment for only one test (I'd love to have one though).lotharamious - Tuesday, May 7, 2013 - link
Another wonderful SSD review, Anand. Well done!Since I started reading your site over 11 years ago your reviews have been really outstanding and particularly so with SSDs.
I really love delving into the data presented, but you guys really need to get with the times on data plotting. Your charts can be somewhat confusing and downright frustrating to read.
When showing scatter plots please include an option for plotting more statistics of the dataset, e.g. trendline about the mean, standard deviation, etc. It's really difficult to see just how well the 800 is gaining performance towards the end of the test run without a noticable trendline for your eyes to follow along the graph.
In a chart, when displaying a line that corresponds to the unit that is currently being reviewed please draw that line ON TOP of the other references units' data lines. It's frustrating to try to compare the performance of different units when the one you really care about is blocked from view because the other 50 lines on the chart make a large enough noisy mess to not be able to tell right from left.
And just for fun, I really wish you guys used a javascript plotting library for your reviews. It would be awesome if you could click on different graphics cards in a graph to see the percentage performance gain you would get between the card you clicked on and all the other cards in the graph. I've seen this kind of stuff on other sites, and it would be amazing to have here.
Sorry for being so negative, because I still love reading this site every day. It's been incredible to see how you, the industry, and the drives themselves have morphed since 2008.
Here's to many more great reviews!
mike55 - Tuesday, May 7, 2013 - link
What causes the sharp drop in IOPS in the random write tests after so many minutes for SSDs? Is it because the drive has run out of empty blocks and is then doing read-modify-writes?mike55 - Tuesday, May 7, 2013 - link
Never mind, just realized my question was answered in the article.HisDivineOrder - Tuesday, May 7, 2013 - link
I imagine Seagate will tap its longterm partner, Samsung, to help it out with SSD controllers once LAMD is gone. Who did Samsung sell its hard drive business to? Seagate.Who did Seagate contract out for NAND from? Samsung.
Seagate'll go back to Samsung once it's time for a new controller that can handle SATAe.
kyuu - Wednesday, May 8, 2013 - link
While this is a decent drive, another source revealed that Seagate is trying to pull warranty shenanigans, limiting the warranty to 3 years OR 72 TB of writes (36 TB for the smaller drives), whichever comes first. Putting a "mileage" limit on the warranty is a first in the SSD space as far as I'm aware, and not something that should be supported. Definite pass on Seagate's SSDs unless and until they change their warranty terms.Kristian Vättö - Wednesday, May 8, 2013 - link
If you look at the warranty terms of other manufacturers, there is always a phrase that says warranty is invalidated if the SSD is operated outside of public specifications (and endurance is one one of them):Intel: "any Product which has been modified or operated outside of Intel’s publicly available
specifications"
http://download.intel.com/support/ssdc/hpssd/sb/1s...
Crucial: "The above warranties cover only defects arising under normal use and do not include malfunctions or failures resulting from misuse, abuse, neglect, alteration, problems with electrical power, usage not in accordance with product instructions"
http://www.crucial.com/company/termsofsale.aspx#li...
OCZ: "Improper use of product, Normal wear and tear"
http://ocz.com/consumer/support/warranty
Or at least that's how I interpret their warranties. In a nutshell, warranty only covers failures which are results of defects in materials or assembly - it's clear that endurance is limited and hence exceeding the specification means that a failure may not have been due to a defect.
daniel_mayes - Wednesday, May 8, 2013 - link
I would like to see consumer vs enterprise in a SMB server. Under a certain price point for example at $1,300 and lower you can get 3 x Intel 710 Series 100GB ($1,200), 5 x Intel DC S3700 100GB ($1,250), 4 x Seagate 600 Pro ($1,300), 5 x OCZ Vector 256 GB ($1,225), 5 x Corsair Neutron GTX 240 GB ($1,100), 5 x Samsung 840 Pro 256 GB ($1,200). Size doesn't matter as much as low latency and highest consistent performance. Since the consumer drives have more space over provision them at 25% and %50. That way we can see if more consumer ssd's at a higher provision rate are faster in a SMB environment than the enterprise drives. Yes I know the consumer ssd's will probably die faster but I'm sure most SMB's would rather pay half the cost of an enterprise drive and chance having to replace it twice as often.Jestre - Wednesday, May 8, 2013 - link
Kristian,is $59.95 with free shipping in your budget?
See http://www.rc-electronics-usa.com/ammeters/dc-amp-...
Not a sweet and an Agilent EPM power meter but it should do the trick at 3% of the price.
Jestre .