The Full Intel SSD 525 Review: 30GB, 60GB, 120GB, 180GB & 240GB Tested
by Anand Lal Shimpi on February 3, 2013 2:30 AM EST- Posted in
- Storage
- SSDs
- Intel
- SandForce
- Intel SSD 520
- Intel SSD 525
Performance Consistency
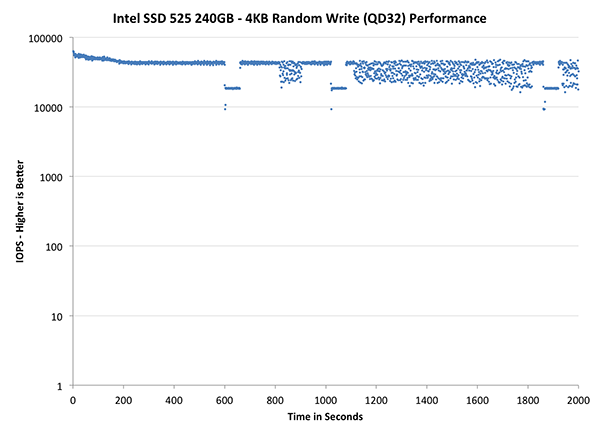
In our Intel SSD DC S3700 review I introduced a new method of characterizing performance: looking at the latency of individual operations over time. The S3700 promised a level of performance consistency that was unmatched in the industry, and as a result needed some additional testing to show that. The reason we don't have consistent IO latency with SSDs is because inevitably all controllers have to do some amount of defragmentation or garbage collection in order to continue operating at high speeds. When and how an SSD decides to run its defrag and cleanup routines directly impacts the user experience. Frequent (borderline aggressive) cleanup generally results in more stable performance, while delaying that can result in higher peak performance at the expense of much lower worst case performance. The graphs below tell us a lot about the architecture of these SSDs and how they handle internal defragmentation.
To generate the data below I took a freshly secure erased SSD and filled it with sequential data. This ensures that all user accessible LBAs have data associated with them. Next I kicked off a 4KB random write workload across all LBAs at a queue depth of 32 using incompressible data. I ran the test for just over half an hour, no where near what we run our steady state tests for but enough to give me a good look at drive behavior once all spare area filled up.
I recorded instantaneous IOPS every second for the duration of the test. I then plotted IOPS vs. time and generated the scatter plots below. Each set of graphs features the same scale. The first two sets use a log scale for easy comparison, while the last set of graphs uses a linear scale that tops out at 40K IOPS for better visualization of differences between drives.
The high level testing methodology remains unchanged from our S3700 review. Unlike in previous reviews however, I did vary the percentage of the drive that I filled/tested depending on the amount of spare area I was trying to simulate. The buttons are labeled with the advertised user capacity had the SSD vendor decided to use that specific amount of spare area. If you want to replicate this on your own all you need to do is create a partition smaller than the total capacity of the drive and leave the remaining space unused to simulate a larger amount of spare area. The partitioning step isn't absolutely necessary in every case but it's an easy way to make sure you never exceed your allocated spare area. It's a good idea to do this from the start (e.g. secure erase, partition, then install Windows), but if you are working backwards you can always create the spare area partition, format it to TRIM it, then delete the partition. Finally, this method of creating spare area works on the drives I've tested here but not all controllers may behave the same way.
The first set of graphs shows the performance data over the entire 2000 second test period. In these charts you'll notice an early period of very high performance followed by a sharp dropoff. What you're seeing in that case is the drive alllocating new blocks from its spare area, then eventually using up all free blocks and having to perform a read-modify-write for all subsequent writes (write amplification goes up, performance goes down).
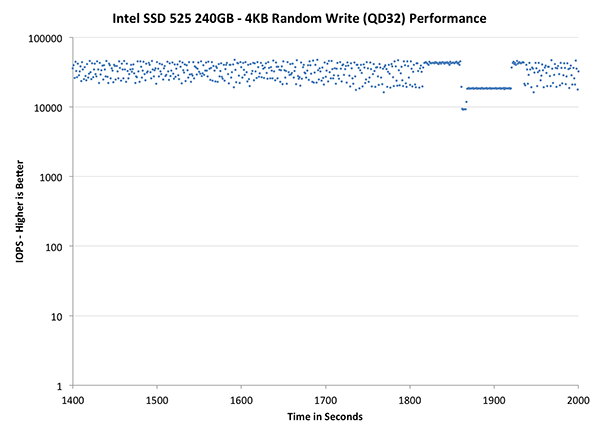
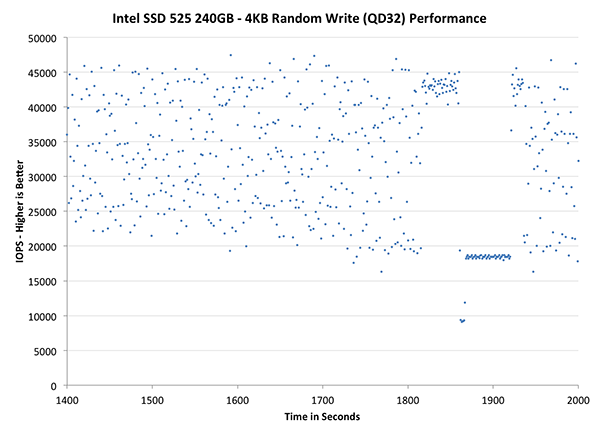
The second set of graphs zooms in to the beginning of steady state operation for the drive (t=1400s). The third set also looks at the beginning of steady state operation but on a linear performance scale. Click the buttons below each graph to switch source data.
| Impact of Spare Area | ||||||||
| Intel SSD DC S3700 200GB | Intel SSD 335 240GB | Intel SSD 525 240GB | Corsair Neutron 240GB | OCZ Vector 256GB | Samsung SSD 840 Pro 256GB | |||
| Default | ||||||||
| 25% Spare Area | - | - | ||||||
As promised I re-ran our consistency tests on the 525 and came up with somewhat different but still slightly odd results, at least compared to the 335. There's a clear degradation in consistency over time, however both the pre-fill and 4KB random writes are using incompressible data which could be a bit unrealistic here. Between your OS and installed applications, there's bound to be more "free" space on any full SF-2281 drive thanks to the inherently compressible nature of a lot of software. The 25% spare area (192GB) toggle shows us what happens to IO consistency if you either only use 192GB of the 256GB of NAND or if you use the entire drive but have some data on it that's fully compressible. The result isn't anywhere near as impactful as what we see on other drives. The SF-2281 controller is reasonably well behaved to begin with, but the fact remains that with incompressible data the controller has to do a lot more work than it was banking on - which causes large variance in IO latency. Minimum performance is still quite good though, especially if you compare the 525 in its default configuration to Samsung's SSD 840 Pro for example. The 525 just doesn't respond as well to additional spare area as conventional SSDs.
The next set of charts look at the steady state (for most drives) portion of the curve. Here we'll get some better visibility into how everyone will perform over the long run.
| Impact of Spare Area | ||||||||
| Intel SSD DC S3700 200GB | Intel SSD 335 240GB | Intel SSD 525 240GB | Corsair Neutron 240GB | OCZ Vector 256GB | Samsung SSD 840 Pro 256GB | |||
| Default | ||||||||
| 25% Spare Area | - | - | ||||||
The final set of graphs abandons the log scale entirely and just looks at a linear scale that tops out at 50K IOPS. We're also only looking at steady state (or close to it) performance here:
| Impact of Spare Area | ||||||||
| Intel SSD DC S3700 200GB | Intel SSD 335 240GB | Intel SSD 525 240GB | Corsair Neutron 240GB | OCZ Vector 256GB | Samsung SSD 840 Pro 256GB | |||
| Default | ||||||||
| 25% Spare Area | - | - | ||||||
IO consistency isn't that great for the SF-2281 controller, although minimum performance remains very good despite the wide distribution of IO latencies. Throwing more spare area at the problem (or just having some compressible data on your drive) does help get rid of the really unusual dips in performance, but the overall distribution remains loosely clustered.


26 Comments
View All Comments
ezrasam - Wednesday, February 6, 2013 - link
Can I add this to my 2 year old Dell N5010?Hok - Thursday, February 7, 2013 - link
hello upgrade to my MSI GT70.... love seeing the mSATA tests!!! THANKS! though the transcend mSATAs currently in there don't seem to be that bad... I would just like more storage. (2 RAID 64s)should I wait for crucial M500?
LeadvilleMatt - Thursday, February 14, 2013 - link
Does anyone know if the current Intel eSATA 525 supports the E7h Flush Cache command? The original SF-22xx did not.Thanks.
damnintel - Wednesday, March 13, 2013 - link
heyyyy check this out damnintel dot commsahni - Monday, March 25, 2013 - link
Hi there,I am contemplating buying mSATA drives 240GB-256GB range. It is really becoming confusing to purchase a drive considering so many different specs.
My options are
1) Crucial m4 mSATA 256GB http://www.newegg.com/Product/Product.aspx?Item=N8...
2) Plextor M5M 256GB http://www.newegg.com/Product/Product.aspx?Item=N8...
3) Intel SSD 525 240GB http://www.newegg.com/Product/Product.aspx?Item=N8...
4) Mushkin Enhanced Atlas 240GB http://www.newegg.com/Product/Product.aspx?Item=N8...
I have not been able to get a head to head comparison of the drives anywhere. Most of the tech spec shootouts are of these drives against older models.
Could you please advise which of these drives in your opinion would be the most eligible buy in a real world consumer scenario..
Cheers....
KVSNARAYANAN - Monday, November 11, 2013 - link
What is the difference between Intel 525 Series SSDMCEAC180B301 & Intel 525 Series SSDMCEAC180A301. I want to replace my Intel 80GB with a 180GB. The last 4 digits are A301 & not B301. Where as B301 is easily available in the market the availability of A301 is very negligible. K.V.S.Narayanan - India (kvsnarayanan@gmail.com)