The Plextor M3 (256GB) Review
by Kristian Vättö on April 5, 2012 3:05 AM ESTAnandTech Storage Bench 2011
Last year we introduced our AnandTech Storage Bench, a suite of benchmarks that took traces of real OS/application usage and played them back in a repeatable manner. Anand assembled the traces out of frustration with the majority of what we have today in terms of SSD benchmarks.
Although the AnandTech Storage Bench tests did a good job of characterizing SSD performance, they weren't stressful enough. All of the tests performed less than 10GB of reads/writes and typically involved only 4GB of writes specifically. That's not even enough exceed the spare area on most SSDs. Most canned SSD benchmarks don't even come close to writing a single gigabyte of data, but that doesn't mean that simply writing 4GB is acceptable.
Originally we kept the benchmarks short enough that they wouldn't be a burden to run (~30 minutes) but long enough that they were representative of what a power user might do with their system. Later, however, we created what we refer to as the Mother of All SSD Benchmarks (MOASB). Rather than only writing 4GB of data to the drive, this benchmark writes 106.32GB. This represents the load you'd put on a drive after nearly two weeks of constant usage. And it takes a long time to run.
1) The MOASB, officially called AnandTech Storage Bench 2011—Heavy Workload, mainly focuses on the times when your I/O activity is the highest. There is a lot of downloading and application installing that happens during the course of this test. Our thinking was that it's during application installs, file copies, downloading, and multitasking with all of this that you can really notice performance differences between drives.
2) We tried to cover as many bases as possible with the software incorporated into this test. There's a lot of photo editing in Photoshop, HTML editing in Dreamweaver, web browsing, game playing/level loading (Starcraft II and WoW are both a part of the test), as well as general use stuff (application installing, virus scanning). We included a large amount of email downloading, document creation, and editing as well. To top it all off we even use Visual Studio 2008 to build Chromium during the test.
The test has 2,168,893 read operations and 1,783,447 write operations. The IO breakdown is as follows:
| AnandTech Storage Bench 2011—Heavy Workload IO Breakdown | ||||
| IO Size | % of Total | |||
| 4KB | 28% | |||
| 16KB | 10% | |||
| 32KB | 10% | |||
| 64KB | 4% | |||
Only 42% of all operations are sequential; the rest ranges from pseudo to fully random (with most falling in the pseudo-random category). Average queue depth is 4.625 IOs, with 59% of operations taking place in an IO queue of 1.
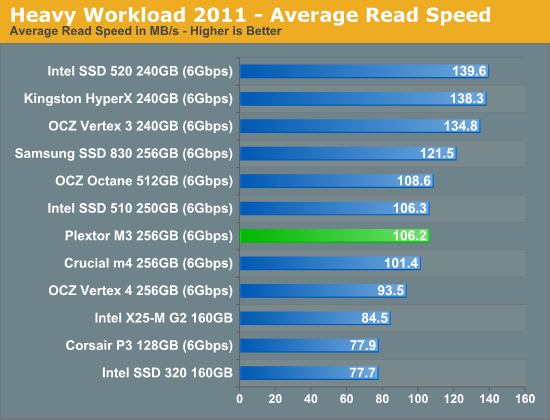
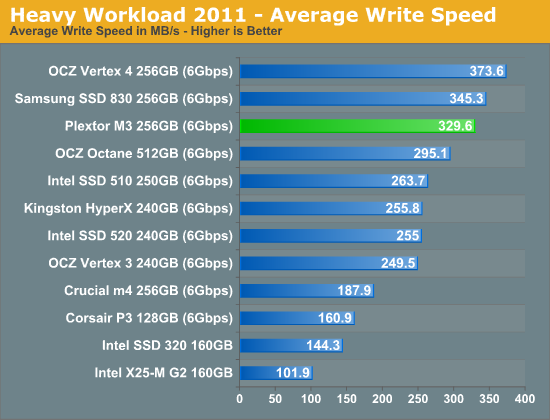
Many of you have asked for a better way to really characterize performance. Simply looking at IOPS doesn't really say much. As a result we're going to be presenting Storage Bench 2011 data in a slightly different way. We'll have performance represented as Average MB/s, with higher numbers being better. At the same time we'll be reporting how long the SSD was busy while running this test. These disk busy graphs will show you exactly how much time was shaved off by using a faster drive vs. a slower one during the course of this test. Finally, we will also break out performance into reads, writes, and combined. The reason we do this is to help balance out the fact that this test is unusually write intensive, which can often hide the benefits of a drive with good read performance.
There's also a new light workload for 2011. This is a far more reasonable, typical every day use case benchmark. It has lots of web browsing, photo editing (but with a greater focus on photo consumption), video playback, as well as some application installs and gaming. This test isn't nearly as write intensive as the MOASB but it's still multiple times more write intensive than what we were running last year.
We don't believe that these two benchmarks alone are enough to characterize the performance of a drive, but hopefully along with the rest of our tests they will help provide a better idea. The testbed for Storage Bench 2011 has changed as well. We're now using a Sandy Bridge platform with full 6Gbps support for these tests.
AnandTech Storage Bench 2011—Heavy Workload
We'll start out by looking at average data rate throughout our new heavy workload test:
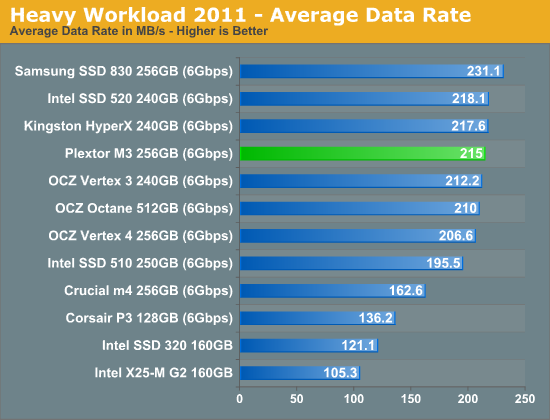
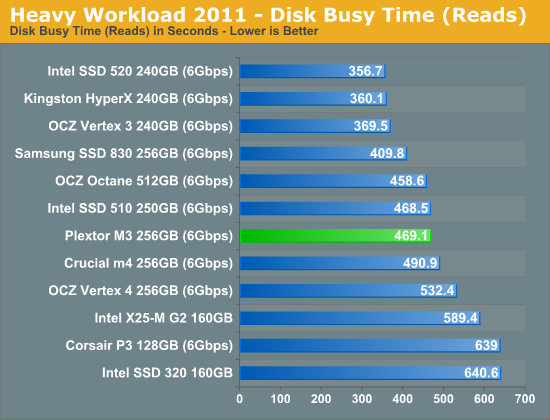
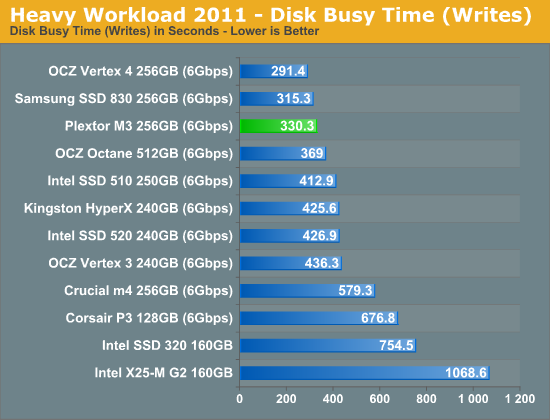
Samsung SSD 830 continues to dominate our Heavy suite but in both read and write, but the M3 is the fastest Marvell based SSD and delivers a result 32% faster than the Crucial m4. Overall the M3 is on-par with SandForce—it does worse in read speed but takes that back in write speed.
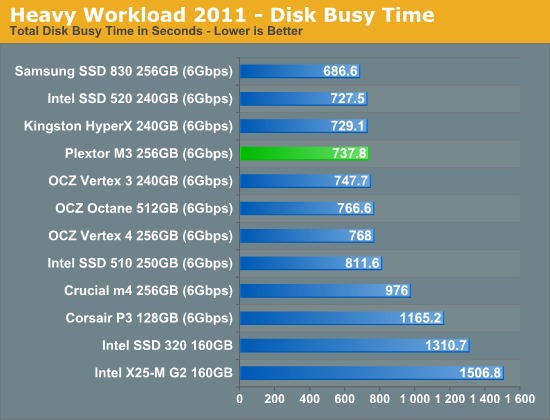
The next three charts just represent the same data, but in a different manner. Instead of looking at average data rate, we're looking at how long the disk was busy for during this entire test. Note that disk busy time excludes any and all idles; this is just how long the SSD was busy doing something:


113 Comments
View All Comments
jwilliams4200 - Thursday, April 5, 2012 - link
And still you are avoiding the issue, which is your reviews have been stating that Sandforce SSDs have better steady-state performance than other SSDs like the Plextor M3, when you have no objective test results to back up such statements.I provided links to two other reviews that showed that the Plextor M3 has substantially better steady-state performance than several Sandforce SSDs. Those reviews (mostly) used the recommendations in the industry standard SNIA SSD test protocols.
All you have is arbitrary measurements, and NOT EVEN THE SAME TESTS RUN ON the Plextor M3 and Sandforce SSDs, and you make the claim that Sandforce is better. That is really not at all credible.
Such misleading states are doing an injustice to your loyal readers. Please do the right thing and correct your misleading claims about the relative steady-state performance of Sandforce SSDs, and also start work on developing an objective, consistently-applied steady-state test for future reviews.
Anand Lal Shimpi - Thursday, April 5, 2012 - link
Neither of the reviews you linked to provided steady state data for client workloads.Keep in mind that we run a ton of data internally that shapes our conclusions.
Here's a chart of high queue depth, steady state performance (sequential precondition, 4KB random write QD32):
http://images.anandtech.com/graphs/graph5719/45462...
The precondition is with incompressible data (iometer 1.1.0-rc1, fully random data pattern) as is the 4KB random write pass.
I'm not sure how others measure steady state random write but most controllers, with standard 7% spare area, fall off significantly after being exposed to random writes for an extended period of time.
Take care,
Anand
jwilliams4200 - Saturday, April 7, 2012 - link
The reviews I linked to follow the industry-standard SNIA guidelines for measuring steady-state performance, at least, an abbreviated version of the guidelines.In contrast to anandtech.com, which has completely arbitrary non-random workloads, in violation of the SNIA guidelines. Even worse, anandtech.com runs different tests on Sandforce SSDs than on non-Sandforce SSDs, and then claims that one SSD is better than another based on the results of different tests!
That is highly misleading and doing an injustic to your readers. anandtech.com really needs to do the right thing here.
rw1986 - Friday, April 6, 2012 - link
Jwilliams -- can you offer any supporting evidence to your claim that the Everest 2 is a "rebadged Marvell 88SS9187"? You mention this in several threads but you have not offered any evidence to support that notion...why should we believe you?jwilliams4200 - Thursday, April 5, 2012 - link
For those who are not familiar with the SNIA SSD testing protocols and specifications:http://www.snia.org/tech_activities/standards/curr...
http://www.snia.org/forums/sssi/pts
kyuu - Friday, April 6, 2012 - link
Yeah, we get it. Thanks.Myself, I think that Anand's finding on low write amplification on the Sandforce drives after long-term, real-world usage is more important, and more relevant, than some arbitrary and artificial benchmark standard. Just because some organization says such and such doesn't mean that any alternative is automatically bunk, or that reviewers aren't credible if they don't follow their procedures to the tee.
jwilliams4200 - Saturday, April 7, 2012 - link
Actually, it does mean that reviews are not credible if they don't follow the appropriate SNIA SSS guidelines. The SNIA SSS test specifications were developed by contributors from more than 20 companies in the industry and were carefully reviewed and compiled to form an objective standard for characterization of the performance of solid state storage devices.The reviews from anandtech are not credible at all, because they do not follow any objective standards at all, let alone the SNIA SSS protocols. Anand even admitted that they do not even run the exact same tests on all SSDs. This makes the results completely arbitrary and unreliable.
LokutusofBorg - Saturday, April 7, 2012 - link
You're a walking, talking example of logical fallacies. And you lost all credibility when you claimed the Vertex 4 is a Marvell controller without proof.Anand has been setting the bar for SSD analysis and testing for years now, and you suddenly come into a comments thread and start sounding the warning that his tests are flawed?
The TRIM/torture tests in every review obviously don't try to compare SSDs against each other. All other tests are objective and run the same on each SSD being compared in the graphs. Anand clearly stated this, and you deceptively or ignorantly misinterpreted what he said. Anybody with half a brain reading these comments can see that you need to spend less time typing and more time reading.
jwilliams4200 - Wednesday, April 11, 2012 - link
http://www.anandtech.com/show/5741/ocz-confirms-oc...Bobsy - Thursday, April 5, 2012 - link
Am I glad to see these comments about Plextor being well-known and highly reputable. I remember upgrading my 486 DX2-66 computer with a Plextor optical drive (4X read-only) that I had paid $400. Plextor hardware was leaps and bounds ahead of anything else at the time. The opening comments from the author made me smile and it was obvious that the author was a young person. It is true that we have not heard about Plextor much in quite some time, at least not in terms of their products being the best.