The Plextor M3 (256GB) Review
by Kristian Vättö on April 5, 2012 3:05 AM ESTAnandTech Storage Bench 2011
Last year we introduced our AnandTech Storage Bench, a suite of benchmarks that took traces of real OS/application usage and played them back in a repeatable manner. Anand assembled the traces out of frustration with the majority of what we have today in terms of SSD benchmarks.
Although the AnandTech Storage Bench tests did a good job of characterizing SSD performance, they weren't stressful enough. All of the tests performed less than 10GB of reads/writes and typically involved only 4GB of writes specifically. That's not even enough exceed the spare area on most SSDs. Most canned SSD benchmarks don't even come close to writing a single gigabyte of data, but that doesn't mean that simply writing 4GB is acceptable.
Originally we kept the benchmarks short enough that they wouldn't be a burden to run (~30 minutes) but long enough that they were representative of what a power user might do with their system. Later, however, we created what we refer to as the Mother of All SSD Benchmarks (MOASB). Rather than only writing 4GB of data to the drive, this benchmark writes 106.32GB. This represents the load you'd put on a drive after nearly two weeks of constant usage. And it takes a long time to run.
1) The MOASB, officially called AnandTech Storage Bench 2011—Heavy Workload, mainly focuses on the times when your I/O activity is the highest. There is a lot of downloading and application installing that happens during the course of this test. Our thinking was that it's during application installs, file copies, downloading, and multitasking with all of this that you can really notice performance differences between drives.
2) We tried to cover as many bases as possible with the software incorporated into this test. There's a lot of photo editing in Photoshop, HTML editing in Dreamweaver, web browsing, game playing/level loading (Starcraft II and WoW are both a part of the test), as well as general use stuff (application installing, virus scanning). We included a large amount of email downloading, document creation, and editing as well. To top it all off we even use Visual Studio 2008 to build Chromium during the test.
The test has 2,168,893 read operations and 1,783,447 write operations. The IO breakdown is as follows:
| AnandTech Storage Bench 2011—Heavy Workload IO Breakdown | ||||
| IO Size | % of Total | |||
| 4KB | 28% | |||
| 16KB | 10% | |||
| 32KB | 10% | |||
| 64KB | 4% | |||
Only 42% of all operations are sequential; the rest ranges from pseudo to fully random (with most falling in the pseudo-random category). Average queue depth is 4.625 IOs, with 59% of operations taking place in an IO queue of 1.
Many of you have asked for a better way to really characterize performance. Simply looking at IOPS doesn't really say much. As a result we're going to be presenting Storage Bench 2011 data in a slightly different way. We'll have performance represented as Average MB/s, with higher numbers being better. At the same time we'll be reporting how long the SSD was busy while running this test. These disk busy graphs will show you exactly how much time was shaved off by using a faster drive vs. a slower one during the course of this test. Finally, we will also break out performance into reads, writes, and combined. The reason we do this is to help balance out the fact that this test is unusually write intensive, which can often hide the benefits of a drive with good read performance.
There's also a new light workload for 2011. This is a far more reasonable, typical every day use case benchmark. It has lots of web browsing, photo editing (but with a greater focus on photo consumption), video playback, as well as some application installs and gaming. This test isn't nearly as write intensive as the MOASB but it's still multiple times more write intensive than what we were running last year.
We don't believe that these two benchmarks alone are enough to characterize the performance of a drive, but hopefully along with the rest of our tests they will help provide a better idea. The testbed for Storage Bench 2011 has changed as well. We're now using a Sandy Bridge platform with full 6Gbps support for these tests.
AnandTech Storage Bench 2011—Heavy Workload
We'll start out by looking at average data rate throughout our new heavy workload test:
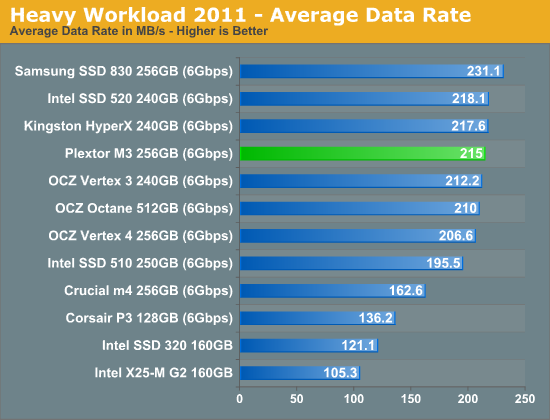
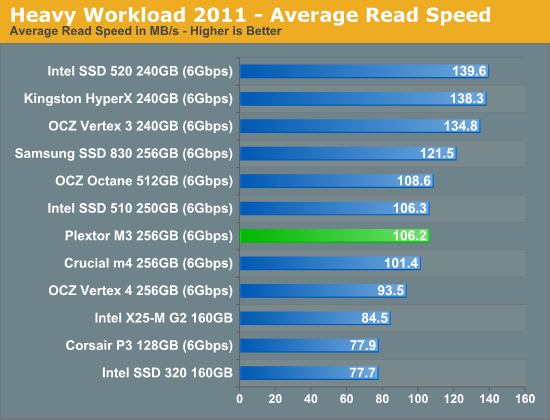
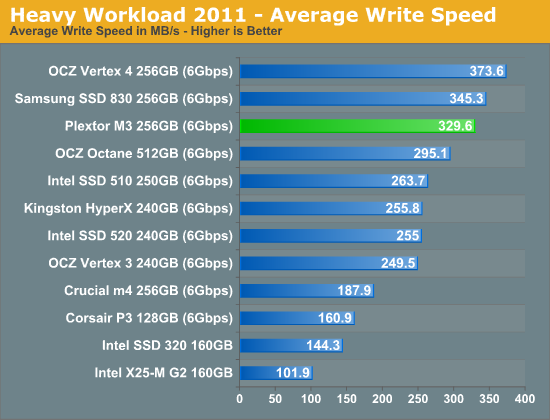
Samsung SSD 830 continues to dominate our Heavy suite but in both read and write, but the M3 is the fastest Marvell based SSD and delivers a result 32% faster than the Crucial m4. Overall the M3 is on-par with SandForce—it does worse in read speed but takes that back in write speed.
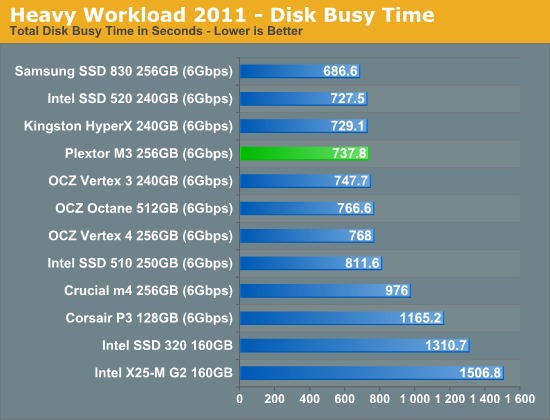
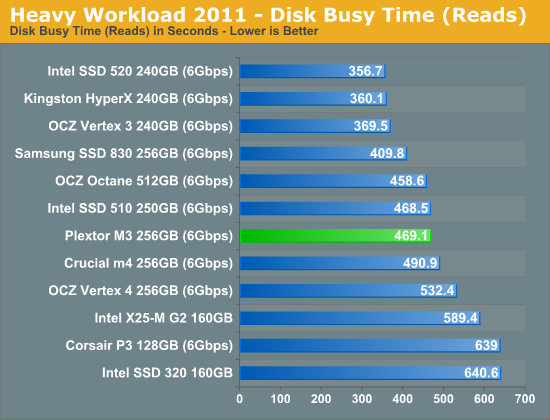
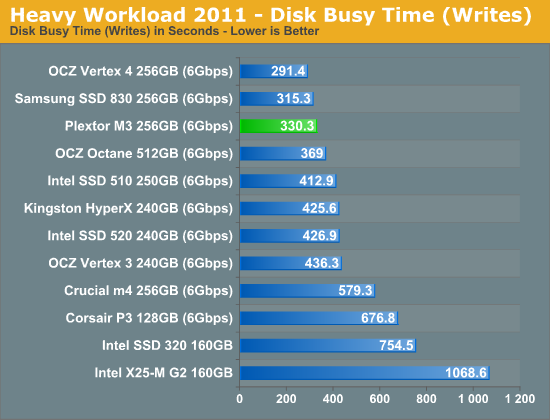
The next three charts just represent the same data, but in a different manner. Instead of looking at average data rate, we're looking at how long the disk was busy for during this entire test. Note that disk busy time excludes any and all idles; this is just how long the SSD was busy doing something:


113 Comments
View All Comments
jwilliams4200 - Thursday, April 5, 2012 - link
I know it is Anand's fault and you are just parroting his erroneous statements, but you guys really need to do better with your steady-state testing. Sandforce is actually among the worst at steady-state performance, and Plextor M3(P) is the best of the consumer SSDs at steady-state performance.anandtech.com should use some version of the SNIA steady-state testing protocol.
Using HDTach is just crazy, since it writes a stream of zeros that is easily compressed by Sandforce SSDs, and thus does not give a good indication of steady-state performance (which SNIA specifies should be tested with random data streams). Besides, the workload of sequential writes spaced across the entire SSD is not realistic at all.
Here are a couple reviews that do a decent job of steady-state testing (could be better, but at least they are far superior to anandtech.com's terrible testing protocols):
scroll down to "Enterprise Synthetic Benchmarks" and look at the "... steady average speed" graphs for steady-state performance:
http://www.storagereview.com/plextor_pxm3p_ssd_rev...
http://www.xbitlabs.com/articles/storage/display/m...
bji - Thursday, April 5, 2012 - link
Jarred and Kristin, I know you guys are reading these comments ... I think you would do very well to respond to this comment. You guys are doing great articles but this looks like something you should definitely consider if you want to be more accurate on steady-state performance.I personally very much care about this issue as the last thing I want is for my drive to fall into JMicron style performance holes. One of the factors that I used in deciding to get the Intel 520s that I got a few weeks ago was the fact that your tests showed that under torture situations the performance is still good. If your tests are not accurate, then I think you really need to address this.
Beenthere - Thursday, April 5, 2012 - link
I use a variety of sources for SSD reviews. Storage Reviews uses some different metrics that may be of interest to those trying to make sense of SSD performance as the benches often do NOT mirror real world performance.To me the Plextor M3 just isn't where it needs to be. The M3 Pro should be the entry level Plextor SSD IMO. It's performance is a little better but currently it's over-priced. It should be priced as the M3 is now.
http://www.storagereview.com/reviews
Anand Lal Shimpi - Thursday, April 5, 2012 - link
Note that we don't use the HDTach approach for SandForce TRIM testing and instead fill the drive with incompressible data, throw incompressible random writes at the drive, and then use AS-SSD to measure incompressible write speed afterwards.Note that fully random data patterns are absolutely not indicative of client workloads at all. What you are saying is quite correct for certain enterprise applications, but not true in the consumer client space (this is also why we have a different enterprise SSD testing suite). IOs in the consumer space end up being a combination of pseudo-random and sequential, but definitely not fully random and definitely not fully random over 100% of the LBA space.
SandForce actually behaves very well over the long run for client workloads as we've mentioned in the past. We have seen write amplification consistently below 1x for client workloads, which is why the SF drives do so very well in client systems where TRIM isn't present.
Our current recommendation for an environment like OS X however continues to be Samsung's SSD 830. Its firmware tends to be a lot better behaved under OS X (for obvious reasons given Samsung's close relationship with Apple), regardless of write amplification and steady state random write behavior.
Take care,
Anand
jwilliams4200 - Thursday, April 5, 2012 - link
"Note that we don't use the HDTach approach for SandForce TRIM testing and instead fill the drive with incompressible data, throw incompressible random writes at the drive, and then use AS-SSD to measure incompressible write speed afterwards."What?
Are you really saying that you test Sandforce SSDs differently from non-Sandforce SSDs, and then you compare the results?
Surely the first rule any decent tester learns is that all devices must be tested in the same way if you are to have a prayer of comparing results.
Anand Lal Shimpi - Thursday, April 5, 2012 - link
We don't directly compare the TRIM/torture-test results, they are simply used as a tool to help us characterize the drive and understand the controller's garbage collection philosophies. HDTach (or an equivalent) is typically for doing that on non-SF drives because you can actually visualize high latency GC routines (dramatic peaks/valleys).The rest of the numbers are directly comparable.
Take care,
Anand
jwilliams4200 - Thursday, April 5, 2012 - link
So your reviews should not make comments comparing the steady-state performance of Sandforce drives to non-Sandforce drives, since you have no objective basis of comparison.SNIA guidelines for SSD testing clearly state that the "tests shall be run with a random data pattern". Other review sites that do steady-state testing comply with this protocol.
anandtech.com is urgently in need of improving its steady-state test protocols and complying with industry standard testing guidelines, since currently anandtech.com is making misleading statements about the relative performance of SSDs in steady-state tests
Anand Lal Shimpi - Thursday, April 5, 2012 - link
As I mentioned before, we have done extensive long term analysis of SandForce drives and came away with a very good understanding of their behavior in client workloads - that's the feedback that's folded into reviews. For client workloads, SF drives have extremely good steady-state characteristics since a lot of data never gets written to NAND (I've mentioned this in previous articles, pointing to sub-1x write amplification factors after several months of regular use).We use both incompressible and compressible data formats in our tests, as well as have our own storage suites that provide a mixture of both. No client system relies on 100% random data patterns or 100% random data access, it's simply not the case. We try our best to make our client tests representative of client workloads.
Our enterprise test suite does look different however, and included within it is a random write steady state test scenario. Even within the enterprise world it is not representative of all workloads, but there are some where it's an obvious fit.
Take care,
Anand
jwilliams4200 - Thursday, April 5, 2012 - link
"As I mentioned before, we have done extensive long term analysis of SandForce drives and came away with a very good understanding of their behavior in client workloads - that's the feedback that's folded into reviews."And as I have explained before, your tests are flawed. You do NOT have a good understanding, because you are unable to specify the actual data that was written to the SSDs during your testing. You are just guessing.
All other studies that have looked at compressibility of data written to Sandforce SSDs in typical consumer workloads have shown that most data is incompressible. The only common data that is compressible is OS and program installs, but that is only done once for most users. Probably your testers were installing lots of programs and OS's and running benchmarks that write easily compressible data, but that is not typical of most consumers. But the bottom line is that you seem to have no idea of what was actually written in your "analysis". So you really do not have a good understanding.
Day to day, most home users write Office documents (automatically compressed before saving), MP3 files, JPGs, compressed video files, and hibernation files (automatically compressed in Win7). All of these are incompressible to sandforce.
But none of that is really relevant to the question of how to test SSDs. The fact is that the only non-arbitrary way to do it is to use random, incompressible data patterns. There is a reason the industry standard SSD test protocols defined by SNIA specify mandatory random data patterns -- because that is the only completely objective test.
Anand Lal Shimpi - Thursday, April 5, 2012 - link
Again - we do use incompressible data patterns for looking at worst case performance on SF drives.There's no impact on incompressible vs. compressible data with these other controllers, so the precondition, high-QD torture, HDTach pass is fine for other drives.
As far as our internal experiment goes - we did more than just install/uninstall programs for 3 - 8 months. Each editor was given a SandForce drive and many of them used the drives as their boot/application drive for the duration of the study. My own personal workstation featured a SF drive for nearly a year, average write amplification over the course of that year was under 0.7x. My own workload involves a lot of email, video editing, photo editing, web browsing, HTML work, some software development, Excel, lots of dealing with archives, presentations, etc... I don't know that I even installed a single application during the test period as I simply cloned my environment over.
We also measured fairly decent write amplification for our own server workloads with Intel's SSD 520.
Take care,
Anand