Intel SSD 520 Review: Cherryville Brings Reliability to SandForce
by Anand Lal Shimpi on February 6, 2012 11:00 AM ESTAnandTech Storage Bench 2011
Last year we introduced our AnandTech Storage Bench, a suite of benchmarks that took traces of real OS/application usage and played them back in a repeatable manner. I assembled the traces myself out of frustration with the majority of what we have today in terms of SSD benchmarks.
Although the AnandTech Storage Bench tests did a good job of characterizing SSD performance, they weren't stressful enough. All of the tests performed less than 10GB of reads/writes and typically involved only 4GB of writes specifically. That's not even enough exceed the spare area on most SSDs. Most canned SSD benchmarks don't even come close to writing a single gigabyte of data, but that doesn't mean that simply writing 4GB is acceptable.
Originally I kept the benchmarks short enough that they wouldn't be a burden to run (~30 minutes) but long enough that they were representative of what a power user might do with their system.
Not too long ago I tweeted that I had created what I referred to as the Mother of All SSD Benchmarks (MOASB). Rather than only writing 4GB of data to the drive, this benchmark writes 106.32GB. It's the load you'd put on a drive after nearly two weeks of constant usage. And it takes a *long* time to run.
1) The MOASB, officially called AnandTech Storage Bench 2011 - Heavy Workload, mainly focuses on the times when your I/O activity is the highest. There is a lot of downloading and application installing that happens during the course of this test. My thinking was that it's during application installs, file copies, downloading and multitasking with all of this that you can really notice performance differences between drives.
2) I tried to cover as many bases as possible with the software I incorporated into this test. There's a lot of photo editing in Photoshop, HTML editing in Dreamweaver, web browsing, game playing/level loading (Starcraft II & WoW are both a part of the test) as well as general use stuff (application installing, virus scanning). I included a large amount of email downloading, document creation and editing as well. To top it all off I even use Visual Studio 2008 to build Chromium during the test.
The test has 2,168,893 read operations and 1,783,447 write operations. The IO breakdown is as follows:
| AnandTech Storage Bench 2011 - Heavy Workload IO Breakdown | ||||
| IO Size | % of Total | |||
| 4KB | 28% | |||
| 16KB | 10% | |||
| 32KB | 10% | |||
| 64KB | 4% | |||
Only 42% of all operations are sequential, the rest range from pseudo to fully random (with most falling in the pseudo-random category). Average queue depth is 4.625 IOs, with 59% of operations taking place in an IO queue of 1.
Many of you have asked for a better way to really characterize performance. Simply looking at IOPS doesn't really say much. As a result I'm going to be presenting Storage Bench 2011 data in a slightly different way. We'll have performance represented as Average MB/s, with higher numbers being better. At the same time I'll be reporting how long the SSD was busy while running this test. These disk busy graphs will show you exactly how much time was shaved off by using a faster drive vs. a slower one during the course of this test. Finally, I will also break out performance into reads, writes and combined. The reason I do this is to help balance out the fact that this test is unusually write intensive, which can often hide the benefits of a drive with good read performance.
There's also a new light workload for 2011. This is a far more reasonable, typical every day use case benchmark. Lots of web browsing, photo editing (but with a greater focus on photo consumption), video playback as well as some application installs and gaming. This test isn't nearly as write intensive as the MOASB but it's still multiple times more write intensive than what we were running last year.
As always I don't believe that these two benchmarks alone are enough to characterize the performance of a drive, but hopefully along with the rest of our tests they will help provide a better idea.
The testbed for Storage Bench 2011 has changed as well. We're now using a Sandy Bridge platform with full 6Gbps support for these tests.
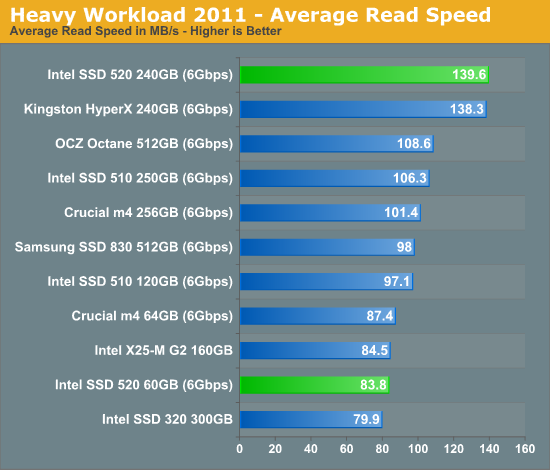
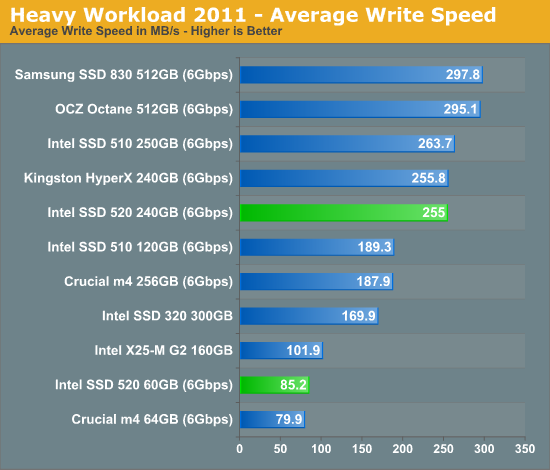
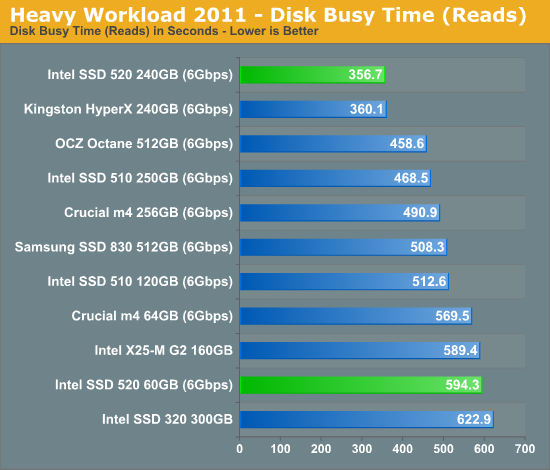
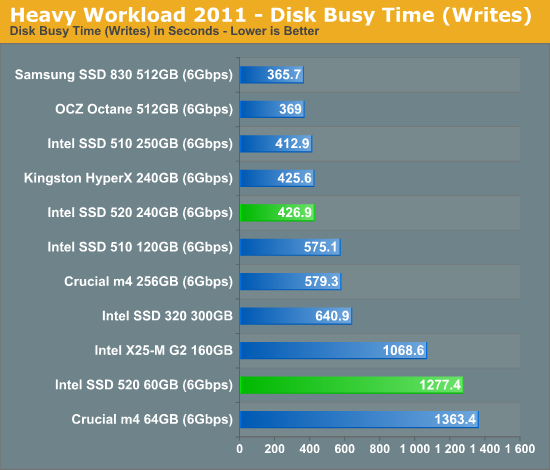
AnandTech Storage Bench 2011 - Heavy Workload
We'll start out by looking at average data rate throughout our new heavy workload test:
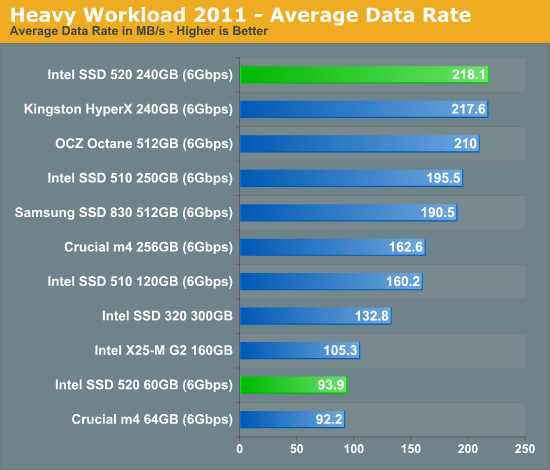
SandForce has always done well in our Heavy Workload test, and the 520 is no different. For heavy multitasking workloads, the 520 is the fastest SSD money can buy. Note that its only hindrance is incompressible write speed, which we do get a hint of in our breakdown of read/write performance below.
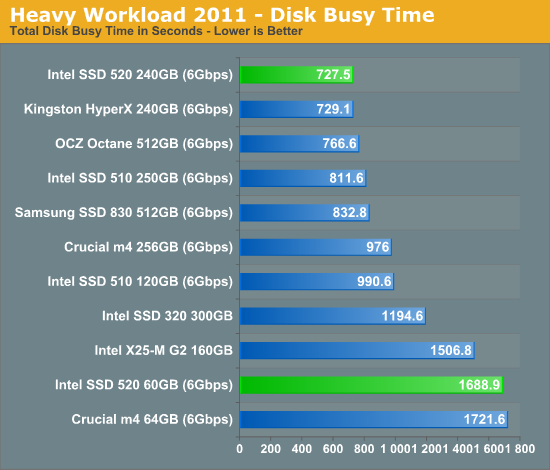
The next three charts just represent the same data, but in a different manner. Instead of looking at average data rate, we're looking at how long the disk was busy for during this entire test. Note that disk busy time excludes any and all idles, this is just how long the SSD was busy doing something:


138 Comments
View All Comments
iLLz - Monday, February 6, 2012 - link
There you go, being all logical and stuff.DanSmith - Tuesday, February 7, 2012 - link
+1kyuu - Monday, February 6, 2012 - link
So, Intel wants people to pay a huge price premium over drives with identical flash and an identical controller? For what? Some validation testing and a custom firmware? Despite the fact that they source their own flash giving them a price advantage over everyone except maybe Samsung? Please.Also, the 240GB is *more* than twice as expensive as as the 120GB? Why wouldn't you just buy two 120GB drives then? I doubt the performance difference is even worth noting, and once Intel's own new RST drivers come out that support passing the TRIM command to RAID arrays comes out, you can R0 them and get *better* performance than a single 240GB.
FunBunny2 - Tuesday, February 7, 2012 - link
*NOT* identical flash or controller. Anand spent much of the text explaining that.NitroWare - Wednesday, February 8, 2012 - link
Not sure if the PCB is completely custom or Intel just put their logo on a slightly modified circuit board - and then there is the Bill of Materials for the supporting components.Corsair have been claiming publicly they went with a custom PCB for their Force 3 and even put up oscilloscope eye diagrams to 'prove' that their signal integrity as superior to a generic reference PCB
Coup27 - Monday, February 6, 2012 - link
Anand, could you please update Bench with the 830 results? They appear to have been forgotten about adding into Bench.Narrlok - Tuesday, February 7, 2012 - link
I second this request. I was about to post about this as well since I wanted to compare the 830 with this drive.beginner99 - Monday, February 6, 2012 - link
Well it seems obvious especially also because of the delay that the general advice here is to not touch OCZ and especially Sandforce seems to be more than true. There obviously must be quite a lot of bugs in the sandforce firmware.But then the price premium? I don't see it. You can get a crucial m4 that preforms just as good and has a very good track record in terms of reliability. (ignoring this 5000 hr bug...but it doubt even intel would spot that)
While it is sure a fast and reliable drive, the m4 is too while costing much less. And the Samsung isn't bad either.
eman17j - Wednesday, February 8, 2012 - link
they fixed the 5000 hr bugeman17j - Wednesday, February 8, 2012 - link
Also the newer line ocz came out with uses the Indilix controller