OCZ Vertex Plus Preview: Introducing the Indilinx Martini
by Anand Lal Shimpi on November 16, 2010 9:31 AM EST- Posted in
- Storage
- SSDs
- OCZ
- Indilinx Martini
- Intrepid
AnandTech Storage Bench
To avoid any potential optimizations for industry standard benchmarks and to provide another example of real world performance we've assembled our own storage benchmarks that we've creatively named the AnandTech Storage Bench.
The first in our benchmark suite is a light/typical usage case. The Windows 7 system is loaded with Firefox, Office 2007 and Adobe Reader among other applications. With Firefox we browse web pages like Facebook, AnandTech, Digg and other sites. Outlook is also running and we use it to check emails, create and send a message with a PDF attachment. Adobe Reader is used to view some PDFs. Excel 2007 is used to create a spreadsheet, graphs and save the document. The same goes for Word 2007. We open and step through a presentation in PowerPoint 2007 received as an email attachment before saving it to the desktop. Finally we watch a bit of a Firefly episode in Windows Media Player 11.
There’s some level of multitasking going on here but it’s not unreasonable by any means. Generally the application tasks proceed linearly, with the exception of things like web browsing which may happen in between one of the other tasks.
The recording is played back on all of our drives here today. Remember that we’re isolating disk performance, all we’re doing is playing back every single disk access that happened in that ~5 minute period of usage. The light workload is composed of 37,501 reads and 20,268 writes. Over 30% of the IOs are 4KB, 11% are 16KB, 22% are 32KB and approximately 13% are 64KB in size. Less than 30% of the operations are absolutely sequential in nature. Average queue depth is 6.09 IOs.
The performance results are reported in average I/O Operations per Second (IOPS):
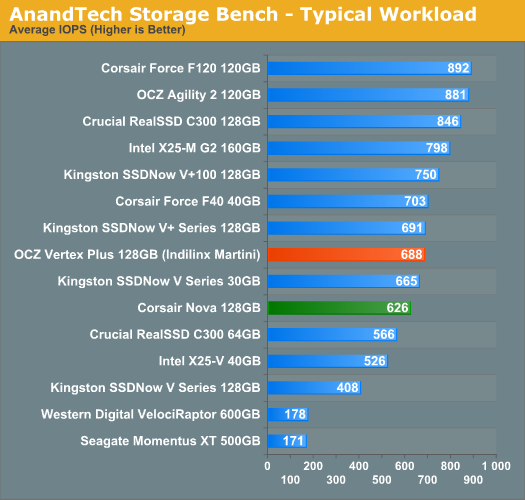
The Martini controller improves performance by around 10% compared to the Barefoot based Corsair Nova. It's enough to bring Indilinx's latest offering within striking distance of the new V+100 and smaller capacity SandForce drives, however the larger capacity SF drives are untouchable.
If there’s a light usage case there’s bound to be a heavy one. In this test we have Microsoft Security Essentials running in the background with real time virus scanning enabled. We also perform a quick scan in the middle of the test. Firefox, Outlook, Excel, Word and Powerpoint are all used the same as they were in the light test. We add Photoshop CS4 to the mix, opening a bunch of 12MP images, editing them, then saving them as highly compressed JPGs for web publishing. Windows 7’s picture viewer is used to view a bunch of pictures on the hard drive. We use 7-zip to create and extract .7z archives. Downloading is also prominently featured in our heavy test; we download large files from the Internet during portions of the benchmark, as well as use uTorrent to grab a couple of torrents. Some of the applications in use are installed during the benchmark, Windows updates are also installed. Towards the end of the test we launch World of Warcraft, play for a few minutes, then delete the folder. This test also takes into account all of the disk accesses that happen while the OS is booting.
The benchmark is 22 minutes long and it consists of 128,895 read operations and 72,411 write operations. Roughly 44% of all IOs were sequential. Approximately 30% of all accesses were 4KB in size, 12% were 16KB in size, 14% were 32KB and 20% were 64KB. Average queue depth was 3.59.
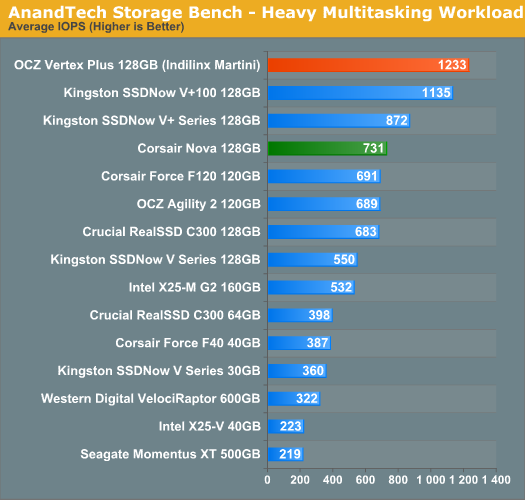
The Toshiba controllers have done very well in our heavy multitasking workload, as did the old Barefoot. Indilinx's Martini outdoes them both. The Vertex Plus is now our highest performing drive in our heavy multitasking workload. The SandForce drives fall short because much of this workload deals with incompressible data (JPEGs, .7z archives, etc...).
The gaming workload is made up of 75,206 read operations and only 4,592 write operations. Only 20% of the accesses are 4KB in size, nearly 40% are 64KB and 20% are 32KB. A whopping 69% of the IOs are sequential, meaning this is predominantly a sequential read benchmark. The average queue depth is 7.76 IOs.
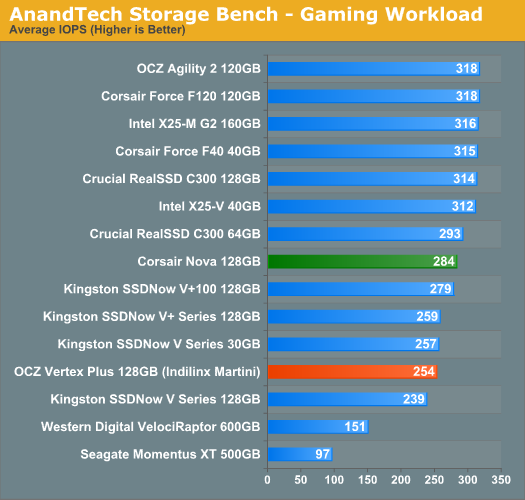
Gaming performance took a slight hit compared to the old Barefoot. It's not enough to be a huge deal, especially considering the other improvements.


61 Comments
View All Comments
landerf - Tuesday, November 16, 2010 - link
What SSD does Anand use personally? I see a lot of user remarks saying they've switched from this or that brand and noticed a feeling of improvement in everyday use, something that may be hard to quantify just looking at benchmarks.Zoridon - Wednesday, November 17, 2010 - link
They need to come out with a 1 TB 3.5 inch version of the Momentus XT with two 500 gb platters and 8 gigs of flash memory. Basically double up on the current 2.5 inch XT for desktops. They could charge 50 percent more for the drive over current 1TB drives and increase desktop performance greatly without sacrificing storage capacity. If they do that I'd raid two in raid 0 and give the finger to SSDs for a few years. They could update to 2TB drives after 6 months for another wave of performace / storage goodness. Am I the only one wanting a destop version of the Momentus XT with these type of stats at an affordable price?Qapa - Wednesday, November 17, 2010 - link
1 - Probably the most important one: when are we going to see the promises price cuts due to the move to lower nm? It was supposed to be this quarter right...?2 - When is the Jet Stream now supposed to come out? (and this also questions the sanity of creating this new Martini, and the effort put into this one which for sure delayed even more Jet Stream...)
3 - I read somewhere that Intel G3 was put on hold due to the presentation of SandForce 2000 series?
4 - When is this SandForce 2000 series expected to come out?
I want a new generation SSD with 64Gb @ around $64!!
iwodo - Wednesday, November 17, 2010 - link
Again we are seeing the same thing.While i would love to trust the benchmark from IOmeter as the raw power of SSD. PC Mark, Sysmark and Anand Test Bench are MUCH closer to real work test, or real work usage scenario.
And after the shocking results from Toshiba new Controller which nearly wins all real world test, the new firmware from indilinx seems to be doing the same as well.
I dont know what is missing, but the preview certainly tells you being the fastest in BOTH Seq Read Write and Random Read Write does not AUTOMATICALLY translate to fastest in real world scenario.
I know a lot of people are focusing on Iometer test, but i to me i have been paying much more attention to Anand Bench.
vailr - Wednesday, November 17, 2010 - link
Version 260.99 WHQL is the most current driver.MHz Tweaker - Wednesday, November 17, 2010 - link
I purchased a pair of of 60gb Vertex 2's about 6 months ago when there was a email blast sale at "The Egg"For the most part I am VERY pleased with my purchase. What I am not pleased with is all the crap I have to go through to make sure I get the best performance.
Example: Booting various Win7 DVD's in order to clean the SSD's followed by booting a USB flash drive version of Ubuntu in order to do a secure erase. Granted, these could be considered performance tweaks but who doesn't want every ounce of speed for their money.
My SSD's came with 1.11 firmware which has performed admirably. Just this past weekend I did my 6month re-install of Win7 x64 and of course with most versions of Windows it feels like a new PC again.
The top of my wish list would be some type of RAID supported TRIM function for these drives, other than that it has been smooth sailing for me. Oh, also I set aside an extra 20gb for spare area in the RAID 0 array to give me 100gb vs. the 120 the pair would normally give. I really don't miss the extra 20gig as I have 9 other hard drive in my box totaling 14TB of storage.
later
MHz
ClagMaster - Wednesday, November 17, 2010 - link
Since there is no indication the controller chip has been changed, the improvement must be from a careful rebalancing of the driver optimizations. The performance gains obtained from this optimization is impressive to say the least.For general usage, PCMARK shows very good performance relative to the Intel and C300 offerings.
The OCZ Vertex Plus offers very good performance for the cost, but at ~$2/GB is still pricy.
ehume - Thursday, November 18, 2010 - link
I get the feeling these tests were all run SATA II/3Gb. Yet the C300 is capable of using SATA III/6Gb. How would the results compare?So far it looks like the Corsair Force 100 is at or near the top in most of the tests. Given that the Force 40 is usually not far behind, the Force 80 looks like a good buy at the right size.
But would the C300 do a lot better on a SATA III motherboard? Or would the SATA contribution not make much difference here?
Hrel - Tuesday, November 23, 2010 - link
I really wish you guys would put two 7200rpm drives with 64MB of cache configured in a Stripe RAID in these performance charts for comparison. Or at least mention the score below the chart since it'd probably mess up the bars. While I know the random stuff would still be WAY lower, I'm curious what PCMark would say about system performance and how sequential activity would compare.gaspard - Friday, November 26, 2010 - link
Samsung 470 Series... would be great to see a review.It's the "other" controller that is up with SF, C300, Intel, Martini...