ASRock's High-End Vision 3D HTPC Reviewed
by Ganesh T S on October 3, 2010 10:20 AM ESTHTPC enthusiasts are often concerned about the quality of pictures output by the system. While this is a very subjective metric, we have decided to take as much of an objective approach as possible. Starting with the Core 100 review, we have been using the HQV 2.0 benchmark for this purpose. The HQV 2.0 test suite consists of 39 different streams divided into 4 different classes. The playback device is assigned scores for each, depending on how well it plays the stream. Each test was repeated multiple times to ensure that the correct score was assigned. The scoring details are available in the testing guide [PDF]. In the table below, we indicate the maximum score possible for each test, and how much the Vision 3D was able to get.
| Vision 3D : HQV 2.0 Benchmark | ||||
| Test Class | Chapter | Tests | Max. Score | Vision3D |
| Video Conversion | Video Resolution | Dial | 5 | 4 |
| Dial with Static Pattern | 5 | 5 | ||
| Gray Bars | 5 | 5 | ||
| Violin | 5 | 3 | ||
| Film Resolution | Stadium 2:2 | 5 | 0 | |
| Stadium 3:2 | 5 | 5 | ||
| Overlay On Film | Horizontal Text Scroll | 5 | 5 | |
| Vertical Text Scroll | 5 | 5 | ||
| Cadence Response Time | Transition to 3:2 Lock | 5 | 5 | |
| Transition to 2:2 Lock | 5 | 0 | ||
| Multi-Cadence | 2:2:2:4 24 FPS DVCam Video | 5 | 0 | |
| 2:3:3:2 24 FPS DVCam Video | 5 | 0 | ||
| 3:2:3:2:2 24 FPS Vari-Speed | 5 | 0 | ||
| 5:5 12 FPS Animation | 5 | 0 | ||
| 6:4 12 FPS Animation | 5 | 0 | ||
| 8:7 8 FPS Animation | 5 | 0 | ||
| Color Upsampling Errors | Interlace Chroma Problem (ICP) | 5 | 5 | |
| Chroma Upsampling Error (CUE) | 5 | 5 | ||
| Noise and Artifact Reduction | Random Noise | SailBoat | 5 | 5 |
| Flower | 5 | 5 | ||
| Sunrise | 5 | 5 | ||
| Harbour Night | 5 | 5 | ||
| Compression Artifacts | Scrolling Text | 5 | 3 | |
| Roller Coaster | 5 | 3 | ||
| Ferris Wheel | 5 | 3 | ||
| Bridge Traffic | 5 | 3 | ||
| Upscaled Compression Artifacts | Text Pattern | 5 | 3 | |
| Roller Coaster | 5 | 3 | ||
| Ferris Wheel | 5 | 3 | ||
| Bridge Traffic | 5 | 3 | ||
| Image Scaling and Enhancements | Scaling and Filtering | Luminance Frequency Bands | 5 | 5 |
| Chrominance Frequency Bands | 5 | 5 | ||
| Vanishing Text | 5 | 5 | ||
| Resolution Enhancement | Brook, Mountain, Flower, Hair, Wood | 15 | 15 | |
| Video Conversion | Contrast Enhancement | Theme Park | 5 | 5 |
| Driftwood | 5 | 5 | ||
| Beach at Dusk | 5 | 5 | ||
| White and Black Cats | 5 | 5 | ||
| Skin Tone Correction | Skin Tones | 10 | 7 | |
| Total Score | 210 | 148 | ||
To put this score in context, let us look at the HQV 2.0 scores obtained in some of our earlier tests. AMD claims that the 5450 has a score of 179, and we will be evaluating that ourselves shortly. However, it is not included in the graph below.
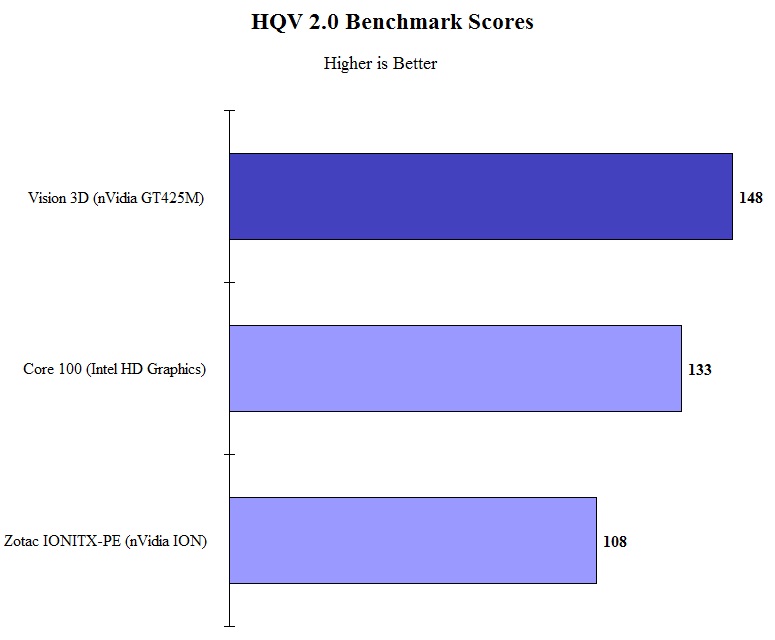
We find that the 425M is better than Intel HD Graphics and the earlier nV GPU (ION) with respect to picture quality. However, we expected it to score much better. The score is bound to improve as the drivers get better and nVidia starts tweaking them for the HQV scores similar to what ATI is doing now.


51 Comments
View All Comments
jacksuper - Wednesday, September 14, 2011 - link
The machine looks beautiful and performs great. However, it died within a week of it's use. It would not power on! The power adapter was ok - something must have happened to the power supply. I was quite disappointed though. Had to return back to amazon.com for a refund.