Server Clash: DELL's Quad Opteron DELL R815 vs HP's DL380 G7 and SGI's Altix UV10
by Johan De Gelas on September 9, 2010 7:30 AM EST- Posted in
- IT Computing
- AMD
- Intel
- Xeon
- Opteron
vApus Mark II
vApus Mark II is our newest benchmarksuite that tests how well servers cope with virtualizing "heavy duty applications". We explained the benchmark methodology here.

* 2 tiles instead of 4 tiles test
** 128GB instead of 64GB
Before we can even start analyzing these numbers, we must elaborate about some benchmark nuances. We had to test several platforms in two different setups to make sure the comparison was as fair as possible. First, let's look at the Xeon 7560.
The Xeon 7560 has two memory controllers, and each controller has two serial memory interfaces. Each SMI connects to two memory buffers, and each buffer needs two DIMMs. Each CPU needs thus eight DIMMs to achieve maximum bandwidth. So our Quad Xeon X7560 needs 32 DIMMs. Now, we also want to do a performance/watt comparison of these servers. So to accomplish this, we decided to test with 16 DIMMs (64GB) in all servers. With 16 channels, bandwidth goes down from 58GB/s to 38GB/s and bandwidth has a tangible impact in a virtualized environment. Therefore, we tested with both 128GB and 64GB. The 128GB number represents the best performance of the quad Xeon 7560; the 64GB number will allow us to determine performance/watt.
Next the dual Opteron and dual Xeon numbers. We tested with both 2- and 4-tile virtualization scenarios. With 2-tiles we demand 36 virtual CPUs, which is more than enough to stress the dual socket servers. As these dual socket servers will be limited by memory space, we feel that the 2-tile numbers are more representative. By comparing the 2-tile numbers with the 4-tile numbers, we take into account that the quad socket systems will be able to leverage their higher number of DIMM slots. So comparing the 2-tile (Dual Socket) with the 4-tile (quad socket) is closest to the real world. However, if you feel that keeping the load the same is more important we added the 4-tile numbers. Four tile numbers result in slightly higher scores for the dual socket systems, and this is similar to how high VMmark scores are achieved. But if you look at the table below, you’ll see that there is another reason why this is not the best way to benchmark:
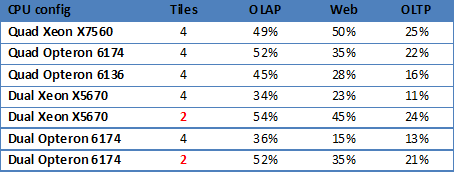
The four tiles benchmark achieves higher throughput, but the individual tiles perform very badly. If you remember, our reference scores (100%) are based on the quad-core Xeon 5570 2.93. You can see that the 4-tile benchmark runs achieve only 13% (Opteron) or 11% (Xeon) of a quad Xeon 5500 on the Oracle OLTP test. That means the OLTP VM gets less than a 1.5GHz Xeon 5570 (half a Xeon 5570). In the 2-tile test, the OLTP VM gets the performance of a full Xeon 5570 core (in the case of AMD, probably 1.5 Opteron “Istanbul” cores).
In the real world, getting much more throughput at the expense of the response times of individual applications is acceptable for applications such as underutilized file servers and authentication servers (an active directory server might only see a spike at 9 AM). But vApus always had the objective of measuring the performance of virtualized performance critical applications such as important web services, OLAP, and OLTP databases. So since performance matters, we feel that the individual response time of the VMs is more important than pure throughput. For our further performance analysis we will use the 2-tile numbers of the dual Xeon and dual Opteron.
The quad Xeon has a 15% advantage over the quad Magny-cours. In our last article, we noted that the quad Xeon 7560 might make sense even to the people who don’t feel that RAS is their top priority. The reason was that the performance advantage over the dual socket server was compelling enough to consider buying a few quad Xeons instead of 2/3 times more dual Xeons. However, the Dell R815 and the 48 AMD cores inside block the way downwards for the quad Intel platform. The price/performance of the Opteron platform is extremely attractive: you can almost buy two Dell R815 for the price of a quad Xeon server and you get 85% of the performance.
The performance advantage over the Dual Xeon X5670 is almost 80% for a price premium of about 30%. You need about twice as many dual Intel servers, so this is excellent value. Only power can spoil AMD’s value party. We’ll look into this later in this article.
Although the quad Opteron 6136 may not enjoy the same fame as its twelve-core 6174 sibling, it is worth checking out. A Dell R815 equipped with four 6136 Opterons and 128GB costs about $12000. Compared to the dual Xeon 5670 with 128GB, you save about $1000 and get essentially 40% more performance for free. Not bad at all. But won’t that $1000 dissipate in the heat of extra power? Let us find out!


51 Comments
View All Comments
JohanAnandtech - Friday, September 10, 2010 - link
Thanks, appreciate you took the time to let us know. We went through 5 weeks of intensive testing and my eyes still hurt from looking at the countless excel sheets, with endless power and response time readings. ;-)FourthLiver - Thursday, September 9, 2010 - link
at the end of page 12, you allude to a performance per watt analysis. looks like you forgot to put it up. i'm chomping at the bit to see those numbers!please disregard me if i failed to rtfa correctly. Anandtech is the best; your (all of you collectively) articles are brilliant and correct down to the smallest details. This is another article that was an absolute joy to read. :]
JohanAnandtech - Thursday, September 9, 2010 - link
Well you can't really calculate it, as it depends on the situation. On low load loads, the system that consumes the less, is the winner, on the condition that the response times stay low. But of course, if your systems are running at low load all time, there might be something wrong: you should have bought more RAM and consolidated more VMs per system.At higher loads, the power consumption at high load divided by the throughput (vApusmark) is close to the truth. But it is definitely not the performance/watt number for everyone
It depends on your workloads. The more critical processing power (think response time SLA) is, the more the last mentioned calculation makes sense. The more we are talking about lots of lightly loaded VMs (like authentification servers, fileservers etc.), the more simply looking at the energy consumed at page 12 make sense.
mino - Thursday, September 9, 2010 - link
First, congratulations to a great article !Now to the small ammount of mess in there:
"the CPUs consume more than the ACP ratings that AMD mentions everywhere"
1) Avegare CPU Power (ACP) is NOT supposed/marketed to represent 100% load power use
Wikipedia: "The average CPU power (ACP), is a scheme to characterize power consumption of new central processing units under "average" daily usage..."
2) 122W at the wall and 110W at the CPU ??? Are you telling us the PSU's are 95% along with VRM/power/fans at 95% efficiency ? (0.95*0.95*1.22=1.10)
. Sorry to spoil the party but that is NOT the case. 122W at wall means 100W at CPU at the most realistically 95W.
Otherwise a great work. Keep is up!
JohanAnandtech - Friday, September 10, 2010 - link
"1) Avegare CPU Power (ACP) is NOT supposed/marketed to represent 100% load power useWikipedia: "The average CPU power (ACP), is a scheme to characterize power consumption of new central processing units under "average" daily usage...""
You are right. But what value does it have? As an admin I want to know what the maximum could be realistically (TDP is the absolute maximum for non-micro periods) and if you read between the lines that is more or less what AMD communicated (see their white paper). if it is purely "average", it has no meaning, because average power can be a quite a bit lower as some servers will run at 30% on average, others at 60%.
These PSU are supposed to be 92-94% efficient and AFAIK the VRMs are at least 90% efficient. So 122 x 0.92 x 0.90 = 101 W.
mino - Saturday, September 11, 2010 - link
Well, I was bit unslept when writing it but anyway. So got a bit harser than should have.In my experience the ACP values pretty well represent your average loaded server (<= 80% load). But that is not the point.
AMD created ACP in a response to the fact that their TDP numbers are conservative while Intel's are optimistic. That was the main cause wery well known to you as well.
Call me an ass but I certainly do not remember AT bitching about Intel TDPs no bein representative (during last 6 years at least).
And we all know too well that those NEVER represented the real power use of their boxen nor did they EVER represented what the "TDP" moniker stands for.
Currently the situation is as such that identical 2P AMD box with 80W ACP has ~ the same power requirements as 2P Intel box with 80W TDP. You have just proven that.
Therefore I believe it would be fair to stop bitching about AMD (or Intel) cheating in marketing (both do) and just say whether the numbers are comparable or not.
Arguing about spin wattage is not really needed.
JohanAnandtech - Monday, September 13, 2010 - link
"Arguing about spin wattage is not really needed. "I have to disagree. The usual slogan is "don't look at TDP, look at measurements". What measurments? The totally unrealistic SPECpower numbers?
It is impossible for review sites to test all CPUs. So it is up to vendors to gives us a number that does not have to be accurate on a few percent, but that let us select CPUs quickly.
Customers should have one number that allows them to calculate worst case numbers which are realistic (heavily load webserver for example, not a thermal virus). So all CPU vendors should agree on a standard. That is not bitching, but is a real need of the sysadmins out there.
mino - Thursday, September 9, 2010 - link
One thing I would love to see is having the lowest end HP server put to its paces.So far it seems to us a the best option for vCenter hosting in small environments (with FT Vm's hosting vCenter).
Maybe even run 1-tile vAPUS (v1? perhaps) on it ?
m3rdpwr - Thursday, September 9, 2010 - link
I would have prepared to have had the DL385 G7 compared.They can be had with 8 and 12 core CPU's.
We have close to 200 HP servers of all models, rack and blades.
Many running vm in our Data Center.
-Mario
duploxxx - Friday, September 10, 2010 - link
same here, we moved also to 385g7 with the new 8-12core cpu's, Nice servers with huge core count since we never run more vCPU then pCPU in a system. Dell 815 looks like a good solution also, it was mentioned in the review the BL685 and DL585 are way more expensive.