Western Digital SiliconEdge Blue Review: WD Enters the Consumer SSD Market
by Anand Lal Shimpi on March 3, 2010 12:00 AM EST- Posted in
- Storage
AnandTech Storage Bench
Note that our 6Gbps controller driver isn't supported by our custom storage bench here, so the C300 results are only offered in 3Gbps mode.
The first in our benchmark suite is a light usage case. The Windows 7 system is loaded with Firefox, Office 2007 and Adobe Reader among other applications. With Firefox we browse web pages like Facebook, AnandTech, Digg and other sites. Outlook is also running and we use it to check emails, create and send a message with a PDF attachment. Adobe Reader is used to view some PDFs. Excel 2007 is used to create a spreadsheet, graphs and save the document. The same goes for Word 2007. We open and step through a presentation in PowerPoint 2007 received as an email attachment before saving it to the desktop. Finally we watch a bit of a Firefly episode in Windows Media Player 11.
There’s some level of multitasking going on here but it’s not unreasonable by any means. Generally the application tasks proceed linearly, with the exception of things like web browsing which may happen in between one of the other tasks.
The recording is played back on all of our drives here today. Remember that we’re isolating disk performance, all we’re doing is playing back every single disk access that happened in that ~5 minute period of usage. The light workload is composed of 37,501 reads and 20,268 writes. Over 30% of the IOs are 4KB, 11% are 16KB, 22% are 32KB and approximately 13% are 64KB in size. Less than 30% of the operations are absolutely sequential in nature. Average queue depth is 6.09 IOs.
The performance results are reported in average I/O Operations per Second (IOPS):
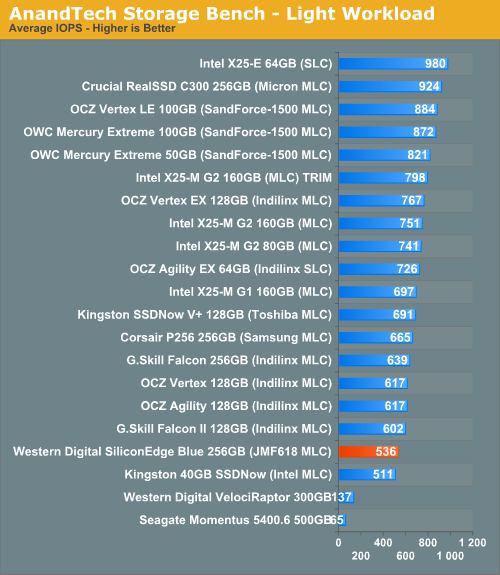
Once again, most users will find the SiliconEdge Blue performing like a low end Indilinx drive - but still much better than any hard drive.
If there’s a light usage case there’s bound to be a heavy one. In this test we have Microsoft Security Essentials running in the background with real time virus scanning enabled. We also perform a quick scan in the middle of the test. Firefox, Outlook, Excel, Word and Powerpoint are all used the same as they were in the light test. We add Photoshop CS4 to the mix, opening a bunch of 12MP images, editing them, then saving them as highly compressed JPGs for web publishing. Windows 7’s picture viewer is used to view a bunch of pictures on the hard drive. We use 7-zip to create and extract .7z archives. Downloading is also prominently featured in our heavy test; we download large files from the Internet during portions of the benchmark, as well as use uTorrent to grab a couple of torrents. Some of the applications in use are installed during the benchmark, Windows updates are also installed. Towards the end of the test we launch World of Warcraft, play for a few minutes, then delete the folder. This test also takes into account all of the disk accesses that happen while the OS is booting.
The benchmark is 22 minutes long and it consists of 128,895 read operations and 72,411 write operations. Roughly 44% of all IOs were sequential. Approximately 30% of all accesses were 4KB in size, 12% were 16KB in size, 14% were 32KB and 20% were 64KB. Average queue depth was 3.59.
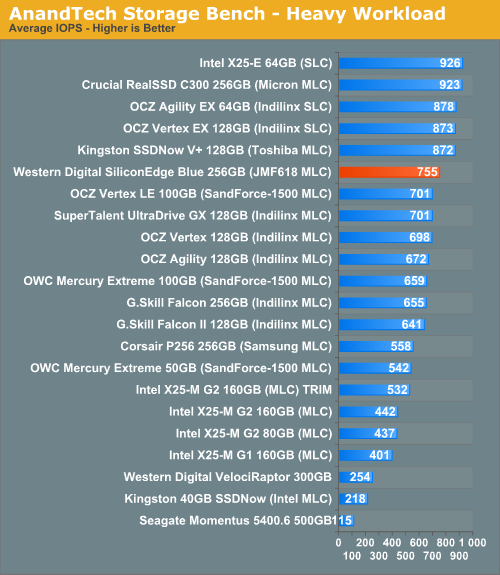
The SiliconEdge Blue follows in the footsteps of Kingston's SSDNow V+ here and does amazingly well in our heavy workload. I'm beginning to wonder if it's the large 64MB external cache at work or something specific to JMicron/Toshiba controllers that seems to do so well in this mostly write-bound multitasking test. It's definitely the exception in the Blue's performance.
The gaming workload is made up of 75,206 read operations and only 4,592 write operations. Only 20% of the accesses are 4KB in size, nearly 40% are 64KB and 20% are 32KB. A whopping 69% of the IOs are sequential, meaning this is predominantly a sequential read benchmark. The average queue depth is 7.76 IOs.
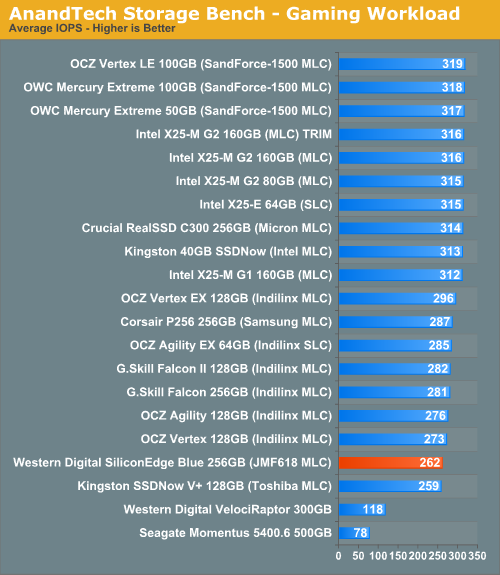
With competitive sequential read speeds, there's no reason that the SiliconEdge Blue shouldn't do well here. Again it's just slightly behind the Indilinx based SSDs.


64 Comments
View All Comments
The0ne - Monday, March 8, 2010 - link
Sorry, but it's price. The technology WILL improve this year. Just based on what you've said, you're talking about the drives being 50% faster than 1960s tech. That's really not saying much as we all know the HD is the bottleneck.I really would like to have a speedy SSD but I'm not going to spend that much on so little (space), even if I could afford them. Just wait a bit more this year and we'll see competition driving prices down :)
coolkev99 - Thursday, March 4, 2010 - link
But yeah.. the price is waaay to high.leexgx - Thursday, March 4, 2010 - link
on this site they managed to make the SSD do the dreaded 0.02MB/s Write issues that the 602 or 602b had under Random Write loads it was doing 2 IOPS as well
http://www.legitreviews.com/article/1233/6/">http://www.legitreviews.com/article/1233/6/
leexgx - Thursday, March 4, 2010 - link
this shows bit more of the issue not been able to keep up under constant Write load doing 0.02MB/shttp://www.legitreviews.com/article/1233/5/">http://www.legitreviews.com/article/1233/5/
my last link was relating to IOPS