Intel Core i9-14900KS Review: The Swan Song of Raptor Lake With A Super Fast 6.2 GHz Turbo
by Gavin Bonshor on May 10, 2024 10:30 AM ESTCPU Benchmark Performance: Science And Simulation
Our Science section covers all the tests that typically resemble more scientific-based workloads and instruction sets. Simulation and Science have a lot of overlap in the benchmarking world. The benchmarks that fall under Science have a distinct use for the data they output – in our Simulation section, these act more like synthetics but, at some level, are still trying to simulate a given environment.
In the encrypt/decrypt scenario, how data is transferred and by what mechanism is pertinent to on-the-fly encryption of sensitive data - a process by which more modern devices are leaning to for software security.
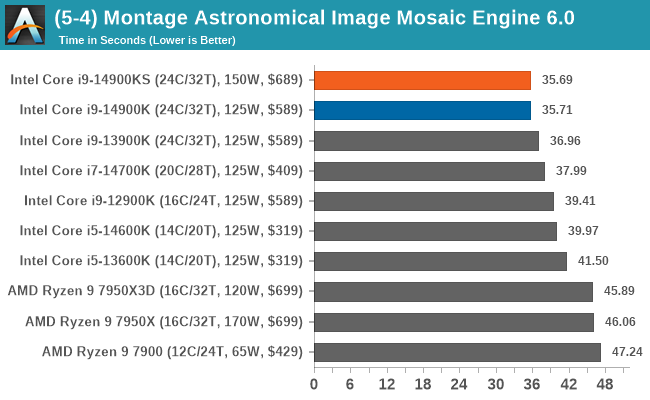
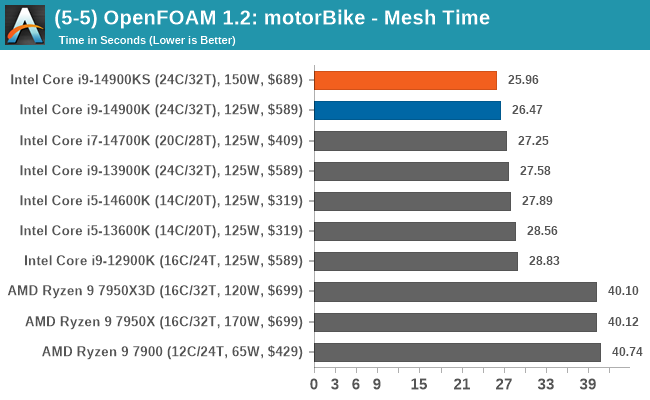
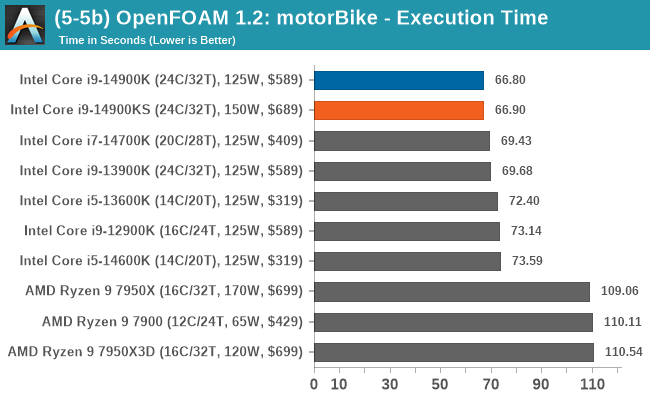
Adding to our 2024 CPU suite, we've included the Montage Astronomical Image Mosaic Engine (MAIM) benchmark and OpenFOAM 1.2 and retained our gaming simulation benchmarks, including our Dwarf Fortress and Factorio benchmarks.
We are using DDR5 memory on the Core i9-14900KS, as well as the other Intel 14th Gen Core series processors including the Core i9-14900K, the Core i7-14700K, Core i5-14600K, and Intel's 13th Gen at the relative JEDEC settings. The same methodology is also used for the AMD Ryzen 7000 series and Intel's 12th Gen (Alder Lake) processors. Below are the settings we have used for each platform:
- DDR5-5600B CL46 - Intel 14th & 13th Gen
- DDR5-5200 CL44 - Ryzen 7000
- DDR5-4800 (B) CL40 - Intel 12th Gen
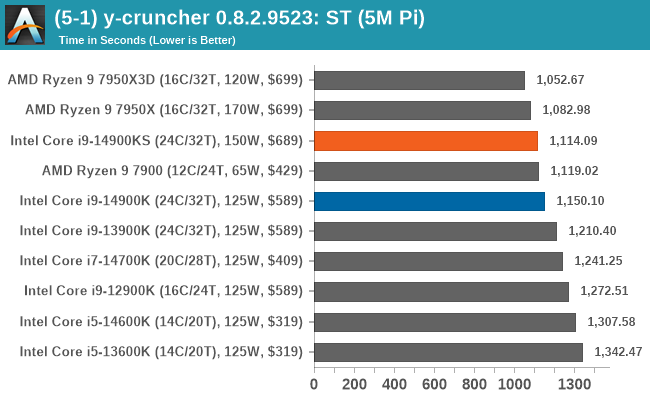
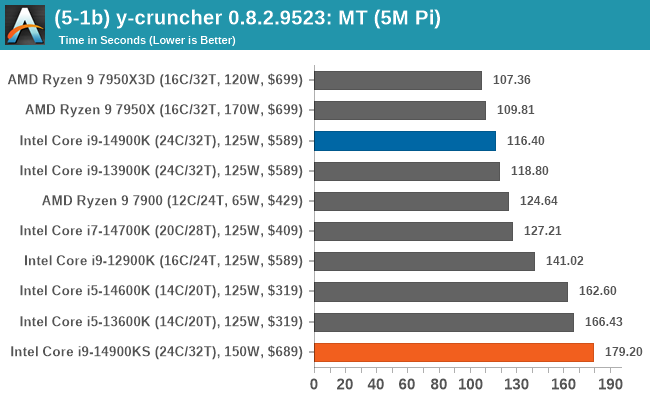
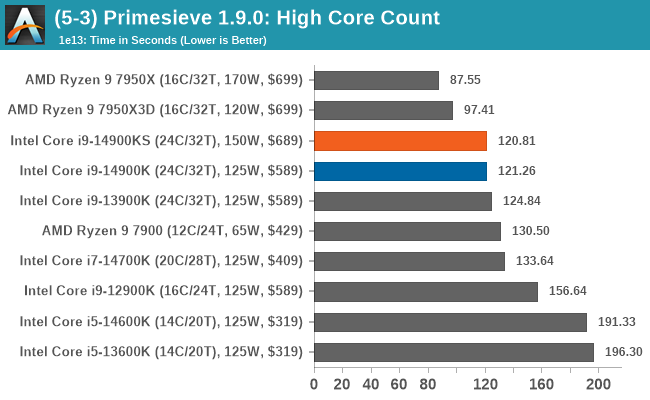
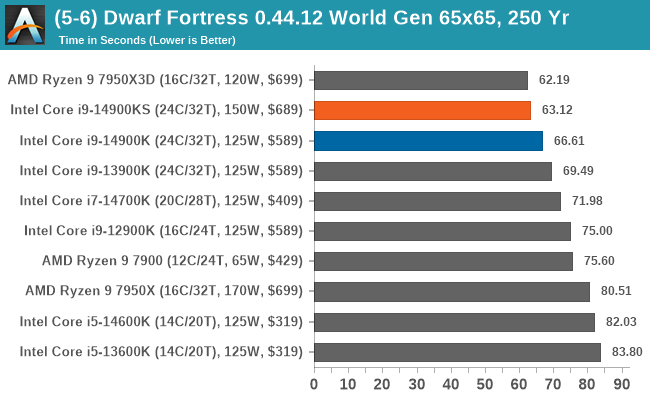
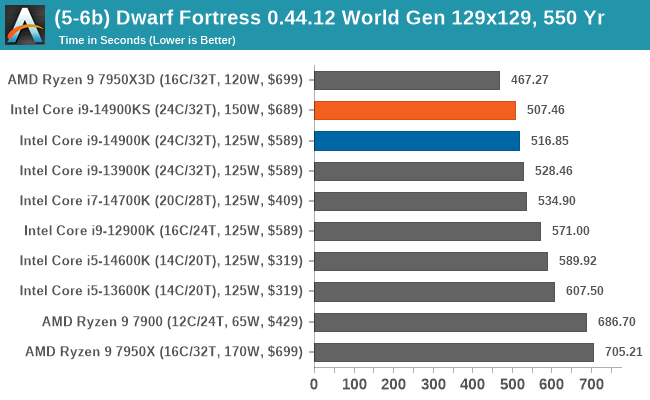
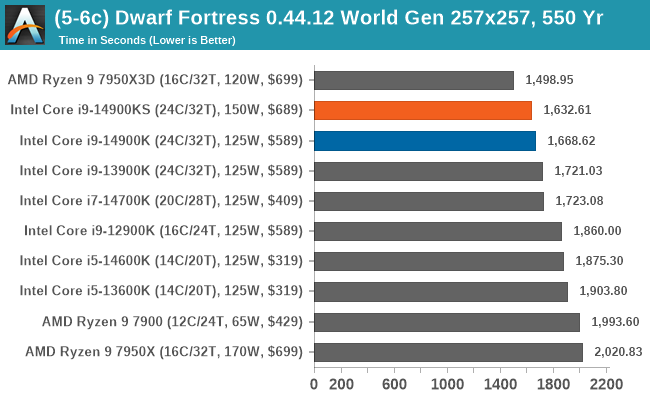
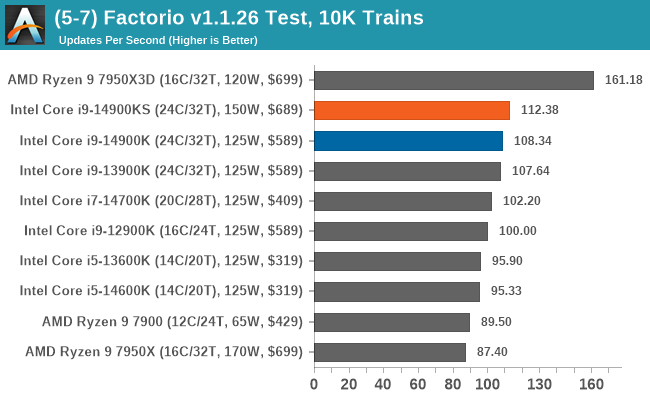
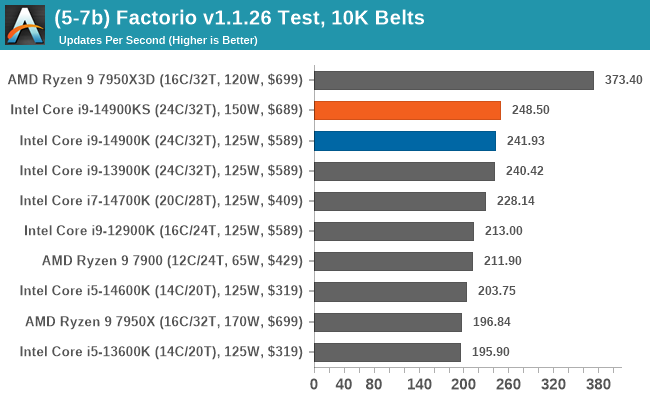
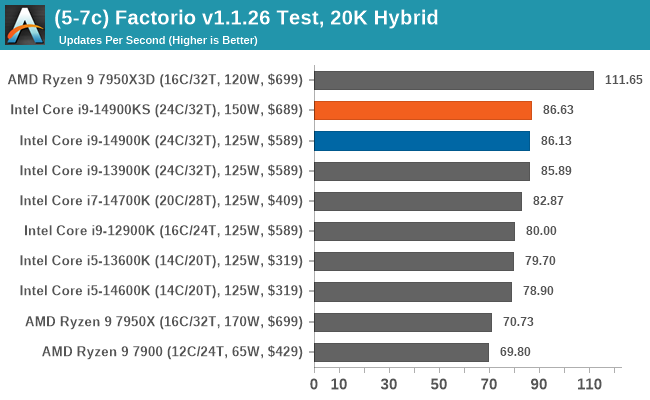
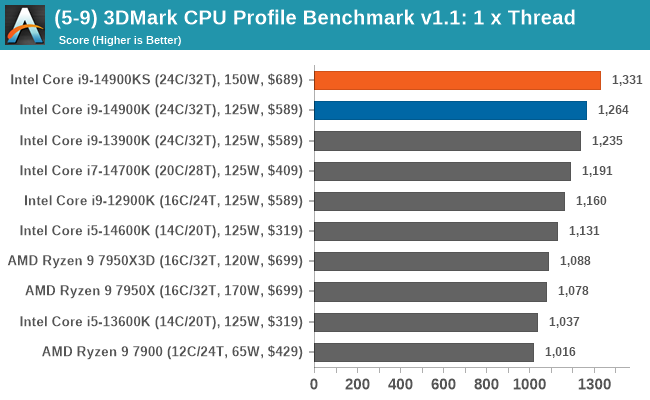
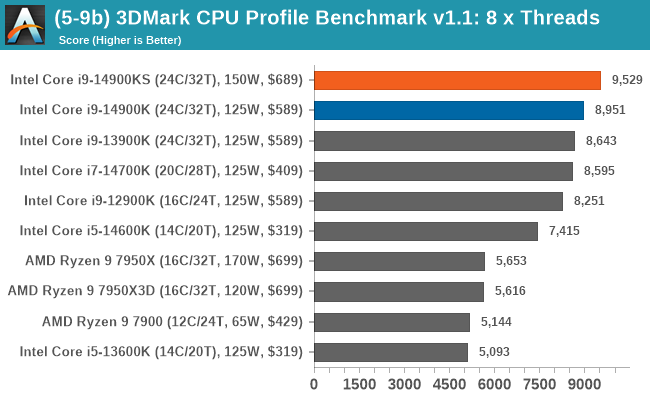
Looking at the results in the science and simulation portion of our CPU test suite, one key result stands out, and that's in Ycruncher multi-threaded. We are currently re-testing this to see if it is an anomaly or if the heavy intensity of the workload negates performance due to thermal constraints. In the rest of the tests, we see some wins for AMD and the Ryzen 7000 series based on their Zen 4 microarchitecture, although Intel also does gain wins here.


54 Comments
View All Comments
PeachNCream - Tuesday, May 14, 2024 - link
They take a light approach to comment removal. Things would have to devolve into petty squabbling or delve into topics like AT's loss of web traffic or credibility so its not like they censor with a heavy hand. It's just to protect Future LLC's financial interests and how it appears to readers. Calm down please. ReplyOxford Guy - Thursday, May 16, 2024 - link
Are you an employee? Replynandnandnand - Friday, May 10, 2024 - link
Instable means unstable?! NoooOOOoo! Replyerotomania - Friday, May 10, 2024 - link
Suffering instability while being unstable...yikes Replyerotomania - Friday, May 10, 2024 - link
Thanks Gavin. Enjoyable read. Pretty steep CPU+cooler investment, considering a $20ish Thermalright air cooler can cool an i5-14600K just fine.Autocorrect may have nipped this phrase: "...decide the IHS from the chip..." Reply
Gavin Bonshor - Friday, May 10, 2024 - link
I appreciate your comment.Also, thank you for spotting that. My apologies! It has now been fixed :) Reply
NextGen_Gamer - Friday, May 10, 2024 - link
I would so love for Anandtech to do another of their IPC-focused articles at this moment between AMD and Intel. Take the Core i9 14900K (or KS, don't matter), disable all the E-cores, and set all the P-cores at the same 4.0GHz. From AMD, use both the Ryzen 7 7800X and 7800X3D, and do the same: set all cores to 4.0GHz. Then take those three setups (Zen 4, Zen 4+X3D, Raptor Lake Refresh) through the full benchmark runs. Everyone on the same amount of cores, same frequency. ReplyHulk - Friday, May 10, 2024 - link
Can we see the v/f curve from the VID of the chip you have for testing?Specifically what are the VID voltages at 6.2 and 5.9? At 6.2 they can vary from just below 1.4V (golden sample) to over 1.5V (really bad). Reply
HideOut - Friday, May 10, 2024 - link
Why is it Anandtech is posting reviews of a CPU thats been out a while now... ReplyThunder 57 - Friday, May 10, 2024 - link
They probably finally got enough ad revenue to buy one since no one samples them anything anymore it seems. Reply