Intel Core i9-14900K, Core i7-14700K and Core i5-14600K Review: Raptor Lake Refreshed
by Gavin Bonshor on October 17, 2023 9:00 AM ESTCPU Benchmark Performance: Rendering
Rendering tests, compared to others, are often a little more simple to digest and automate. All the tests put out some sort of score or time, usually in an obtainable way that makes it fairly easy to extract. These tests are some of the most strenuous in our list, due to the highly threaded nature of rendering and ray-tracing, and can draw a lot of power.
If a system is not properly configured to deal with the thermal requirements of the processor, the rendering benchmarks are where it would show most easily as the frequency drops over a sustained period of time. Most benchmarks, in this case, are re-run several times, and the key to this is having an appropriate idle/wait time between benchmarks to allow for temperatures to normalize from the last test.
Some of the notable rendering-focused benchmarks we've included for 2024 include the latest CineBench 2024 benchmark and an update to Blender 3.6 and V-Ray 5.0.2.
We are using DDR5 memory on the Core i9-14900K, Core i7-14700K, Core i5-14600K, and Intel's 13th Gen at the relative JEDEC settings. The same methodology is also used for the AMD Ryzen 7000 series and Intel's 12th Gen (Alder Lake) processors. Below are the settings we have used for each platform:
- DDR5-5600B CL46 - Intel 14th & 13th Gen
- DDR5-5200 CL44 - Ryzen 7000
- DDR5-4800 (B) CL40 - Intel 12th Gen
Note: As we are running with a completely refreshed CPU test suite, this means we are currently re-testing other processors for our data sets. These will be added to the below graphs as soon as we have more results, and these will also be added to our Bench database. Thanks for your understanding.
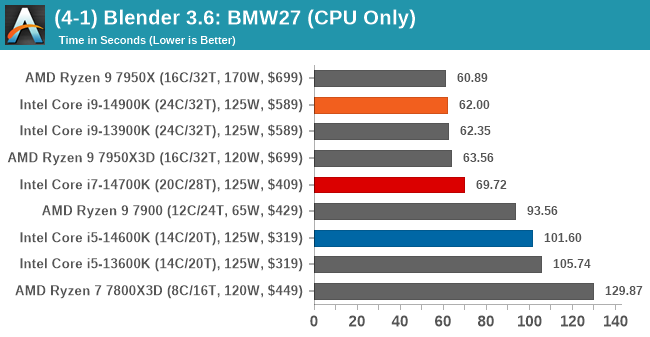
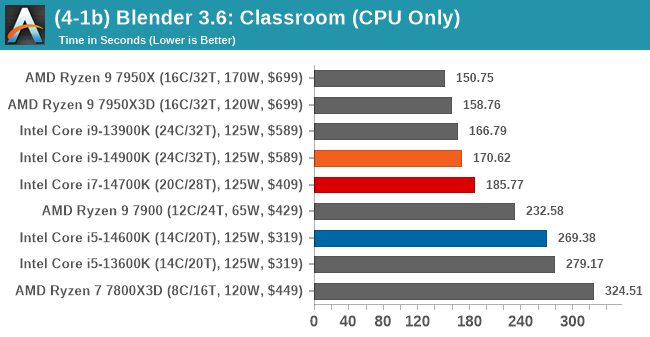
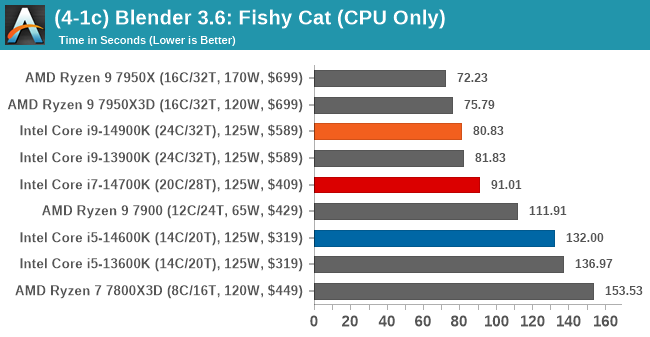
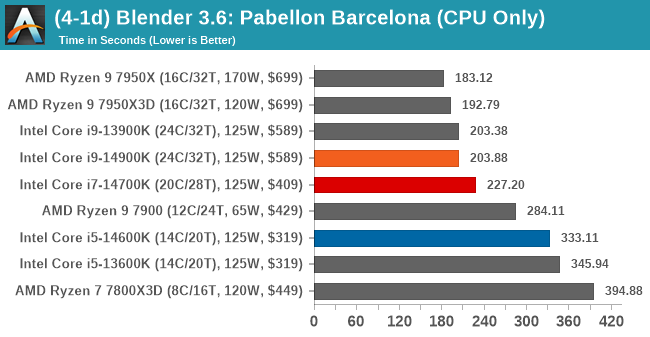
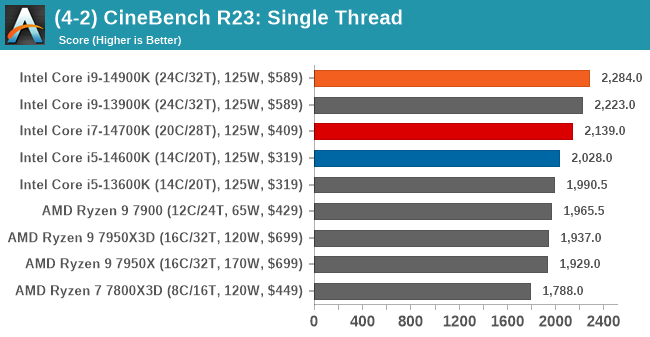
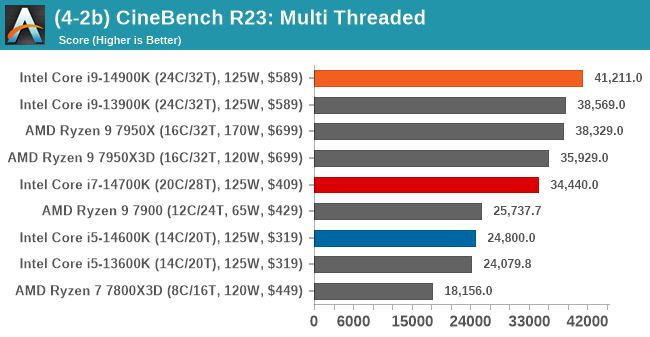
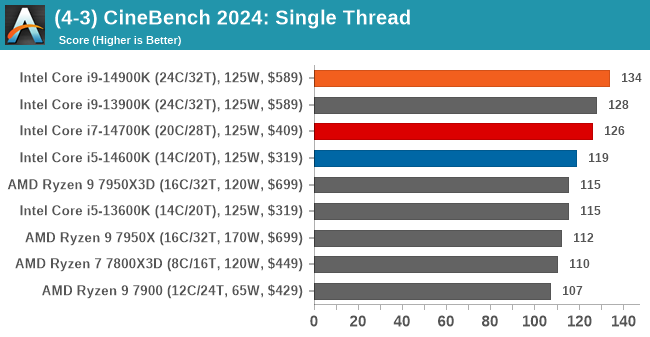
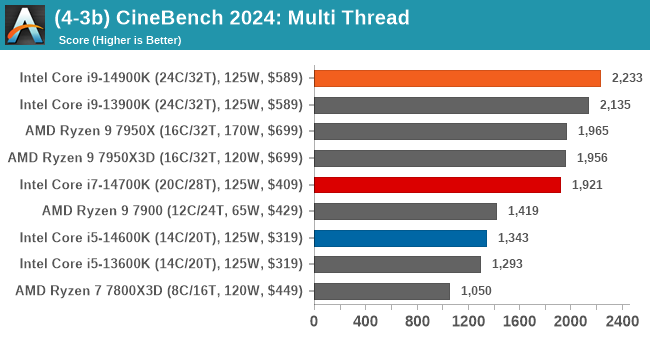
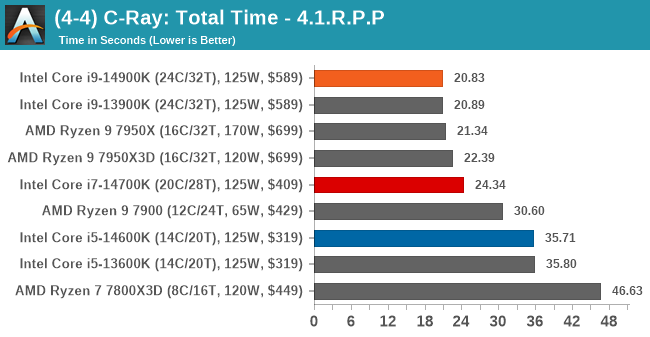
Although the Ryzen 9 7950X holds the top spot in Blender 3.6, the Core i9-14900K is clearly ahead in ST and MT performance in CineBench R23 and CineBench 2024. Per our encoding performance testing, the Core i5-14600K trades blows with the Ryzen 9 7900 again and is on level terms with the Core i5-14600K. The Core i7-14700K is again closer to the flagship chips and, in both CineBench MT tests, is close to AMD's Ryzen 9 7950X3D.


57 Comments
View All Comments
cmdrdredd - Wednesday, October 18, 2023 - link
You aren't even the target market for any of this so your comment is useless and pointless. You are not an enthusiast, gamer, or need the power for work.ItsAdam - Wednesday, October 18, 2023 - link
I old a 4090 and I wouldn't want a CPU with the same power as it. I was waiting for Meteor Lake upgrading from my 5800X3D, but when I heard it was a refresh I was like oh no.Looks like I'm going to be a beta tester for AMDs 6000 series, and I'm quite frankly bored of AMD and it's crash test consumer development.
I know times are changing, I know, and I loved to tinker but it's getting too long in the tooth with AMD ATM with all the agesa "fixes" which is usually a big performance loss.
I really wanted INTEL to come out brawling,but all they're doing is digging their own grave.
They shouldn't have released ANOTHER refresh, especially one as bad as this.
lilo777 - Wednesday, October 18, 2023 - link
You do not pay the utility for peak power consumption. You pay for actual consumption which is much lower because power peaks are rare and short.mode_13h - Wednesday, October 18, 2023 - link
> power peaks are rare and short.Depends on what you're doing. If rendering, video encoding, or lots of software compilation, then not necessarily.
mode_13h - Wednesday, October 18, 2023 - link
Thanks for continuing to run SPEC2017, but I'm really missing the cumulative scores. Also, I wish we could get cumulative scores on E-cores only and P-cores only, as well as populating that graph with some other popular CPUs, as was done up to the i9-12900K review.For reference, please see the chart titled "SPEC2017 Rate-N Estimated Total", at the bottom of this page:
https://www.anandtech.com/show/17047/the-intel-12t...
The following page of that review goes on to explore the P & E cores.
Perhaps this would be good material for a follow-on article?
eloyard - Thursday, October 19, 2023 - link
2000s called, want their Net-Burst back.Reinforcer - Saturday, October 28, 2023 - link
Then don't let the motherboard run away with power lol, Honestly what is wrong with you reviewers fixated on how much power it can draw? Set it to Intel's 253w limit and enjoy almost the same performance as one that is consuming stupid amounts of power, It's not rocket science or do we not know how to set a motherboard up these days?