Intel Core i9-14900K, Core i7-14700K and Core i5-14600K Review: Raptor Lake Refreshed
by Gavin Bonshor on October 17, 2023 9:00 AM ESTCPU Benchmark Performance: Power, Productivity and Web
Our previous sets of ‘office’ benchmarks have often been a mix of science and synthetics, so this time, we wanted to keep our office and productivity section purely based on real-world performance. We've also incorporated our power testing into this section.
The biggest update to our Office-focused tests for 2024 and beyond includes UL's Procyon software, which is the successor to PCMark. Procyon benchmarks office performance using Microsoft Office applications and Adobe Premier Pro's video editing capabilities.
We are using DDR5 memory on the Core i9-14900K, Core i7-14700K, Core i5-14600K, and Intel's 13th Gen at the relative JEDEC settings. The same methodology is also used for the AMD Ryzen 7000 series and Intel's 12th Gen (Alder Lake) processors. Below are the settings we have used for each platform:
- DDR5-5600B CL46 - Intel 14th & 13th Gen
- DDR5-5200 CL44 - Ryzen 7000
- DDR5-4800 (B) CL40 - Intel 12th Gen
Note: As we are running with a completely refreshed CPU test suite, this means we are currently re-testing other processors for our data sets. These will be added to the below graphs as soon as we have more results, and these will also be added to our Bench database. Thanks for your understanding.
Power
The nature of reporting processor power consumption has become, in part, a bit of a nightmare. Historically the peak power consumption of a processor, as purchased, is given by its Thermal Design Power (TDP, or PL1). For many markets, such as embedded processors, that value of TDP still signifies the peak power consumption. For the processors we test at AnandTech, either desktop, notebook, or enterprise, this is not always the case.
Modern high-performance processors implement a feature called Turbo. This allows, usually for a limited time, a processor to go beyond its rated frequency. Exactly how far the processor goes depends on a few factors, such as the Turbo Power Limit (PL2), whether the peak frequency is hard coded, the thermals, and the power delivery. Turbo can sometimes be very aggressive, allowing power values 2.5x above the rated TDP.
AMD and Intel have different definitions for TDP that are, broadly speaking, applied the same. The difference comes from turbo modes, turbo limits, turbo budgets, and how the processors manage that power balance. These topics are 10000-12000 word articles in their own right, and we’ve got a few articles worth reading on the topic.
- Why Intel Processors Draw More Power Than Expected: TDP and Turbo Explained
- Talking TDP, Turbo and Overclocking: An Interview with Intel Fellow Guy Therien
- Reaching for Turbo: Aligning Perception with AMD’s Frequency Metrics
- Intel’s TDP Shenanigans Hurts Everyone
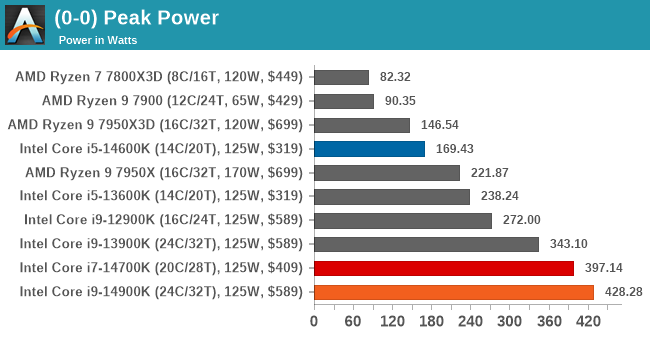
First off, we somehow managed to pull 428 W with the Core i9-14900K, which for a processor that hasn't been manually overclocked or pushed beyond what the motherboard is doing through the firmware is just ridiculous – and this is not a compliment. Compared to the Core i9-13900K, which we re-tested on the same MSI MEG Z790 Ace MAX motherboard, our peak power tests pulled 343 W of power from the CPU. We've reached out to MSI directly to figure out what's going on, and although it could have been a power spike, one that high isn't ideal nor safe for the silicon.
Looking at the peak power values on the Core i7-14700K and Core i5-14600K, the Core i7-14700K was also quite power-hungry with a peak power of 397 W on our MSI MEG Z790 Ace MAX motherboard. The Core i5-14600K, on the other hand, actually pulled 169 W, which was around 28% lower than the Core i5-13600K. This is a marked improvement comparing the two Core i5 processors, especially when comparing the Core i9-14900K to the Core i9-13900K, which tells a much different story.
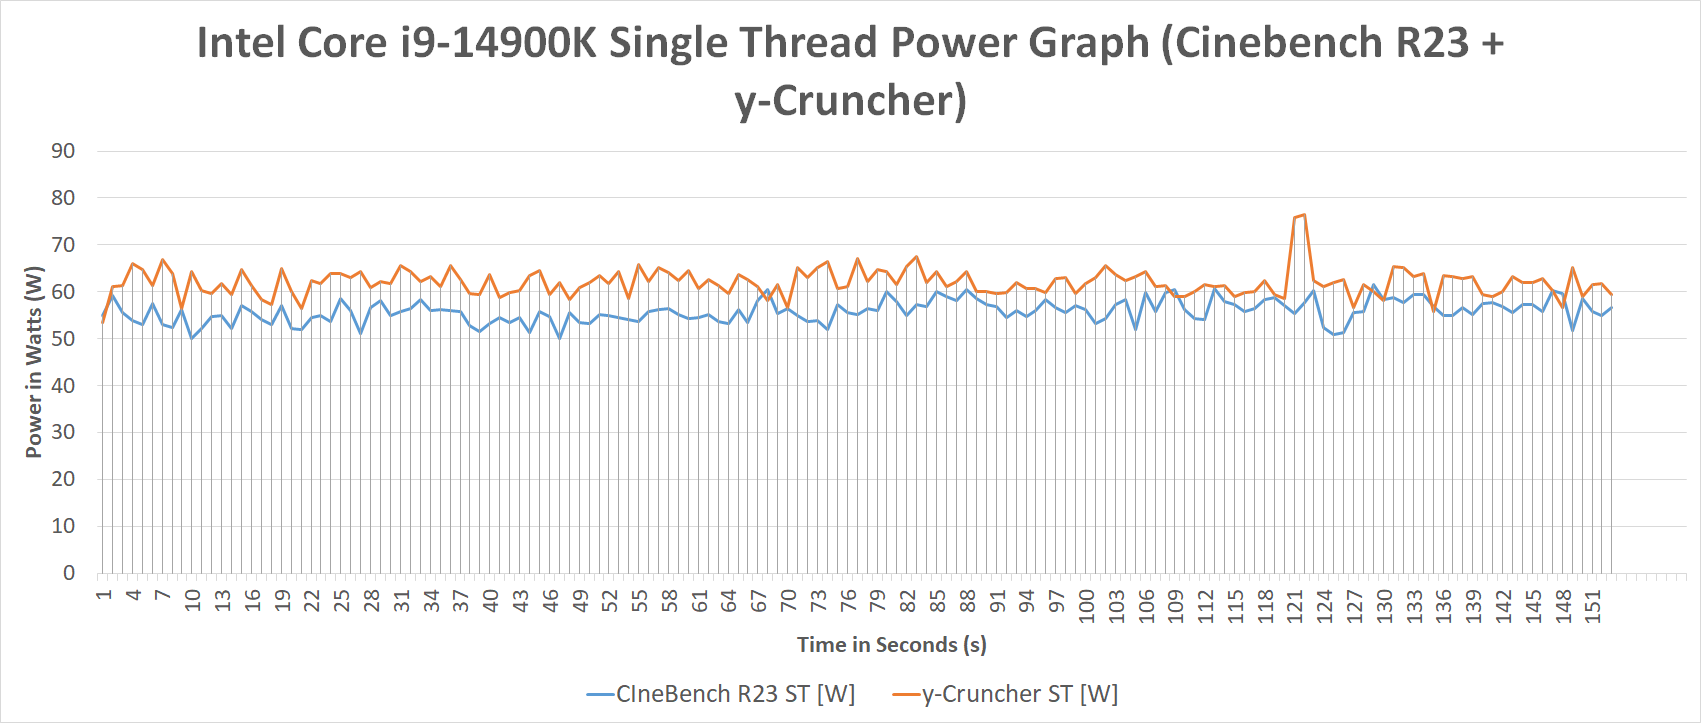
Taking a slightly deeper look at power, we've split our Core i9-14900K power analysis into two areas: single-threaded and multi-threaded. Using two different benchmarks from our suite to look at power (CineBench R23 and y-Cruncher), we can see different load variations between the two. While y-Cruncher is inherently more intensive than CineBench R23, both represent different load intensities on a single thread. As we can see in our single-threaded power graph, we observed between 50 and 70 W of general power consumption with one thread loaded to the maximum. In y-Cruncher, we did observe a spike in power of 78 W. Typically, single-threaded loads don't come close to enabling power limits such as PL1 and PL2, but we can see what a single-threaded application with low and high-intensity workloads.
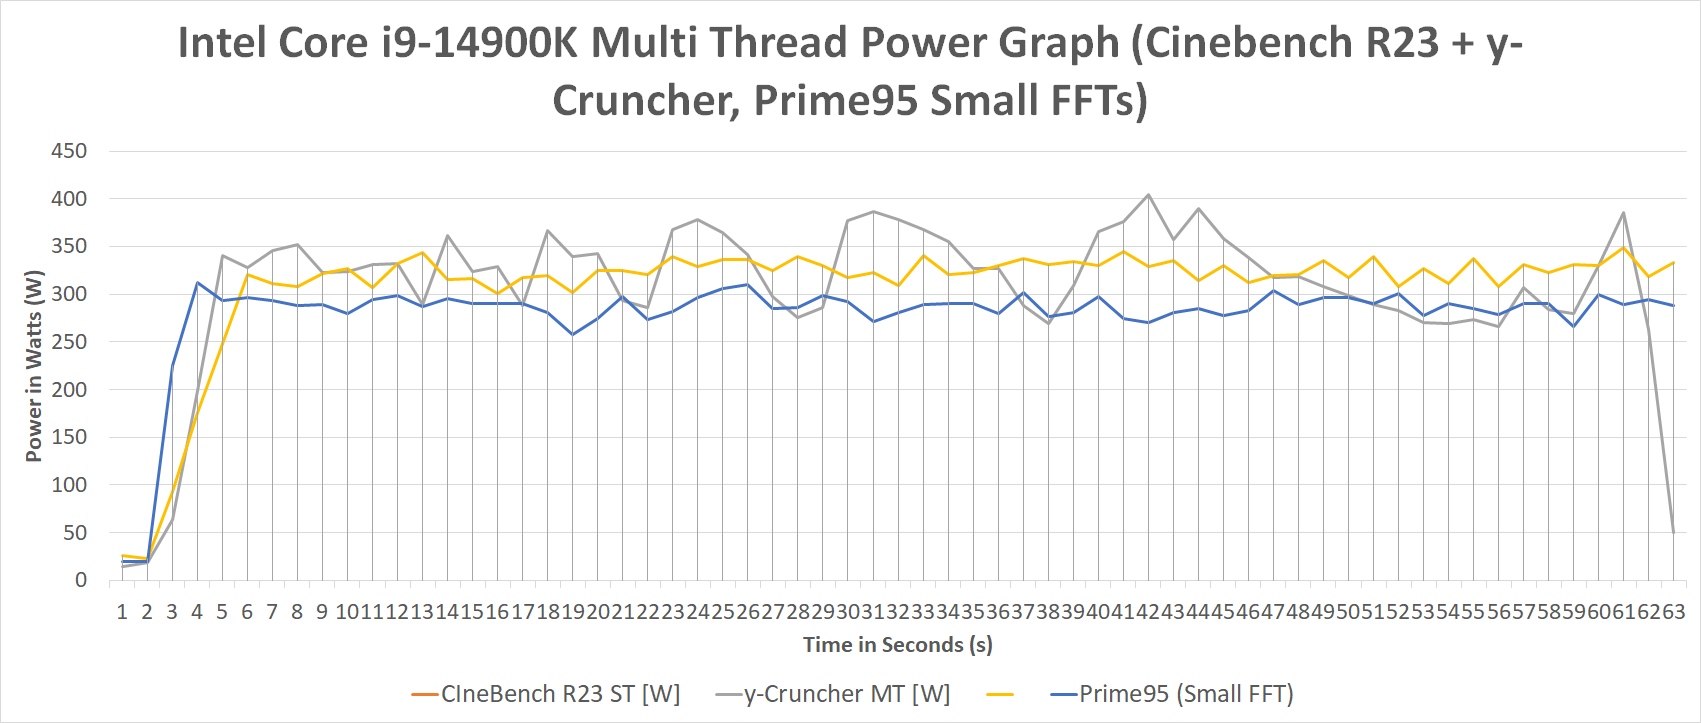
Moving onto multi-threaded power consumption, we've also thrown a Prime95 stress test with small FFTs into the equation. As we can see, y-Cruncher pulls more power and spikes more furiously than CineBench 23 MT and Prime95 again. Even though the Core i9-14900K has a PL1 and PL2 value of 253 W (same as the Core i9-13900K), motherboard vendors at default settings typically push more power through the processor, making TDP and power limits something of a moot point. Of course, users can opt to run settings specifically at Intel's default specification, but no Z790 motherboard applies these by default as they race for the performance crown.
In our MT power testing, we observed between 250 W and 400 W across all three workloads, which is a very wide variation with all the cores and threads loaded up. As we know, y-Cruncher is more unpredictable, more overzealous, and more intensive, which caused a peak of 401 W; this wasn't uncommon throughout our testing, and it's clear that the Core i9-14900K isn't only faster in clock speeds than the Core i9-13900K, but with a peak of 428 W in our peak power test, it can draw much more power too. This is something to bear in mind, especially when it comes to selecting optimal cooling, as, once again, Intel's platforms pull a lot of power and generate a considerable amount of heat, too.
Update: 10/25/2023: Added some further power analysis highlighting the differences between the MSI MEG Z790 Ace Max and the ASRock Z790 Taichi Carrara motherboards with the Core i9-14900K (same sample).
Using our Linx power loader script to put an intensive workload on both the MSI MEG Z790 Ace Max motherboard, which we used for our Intel 14th Gen review, and the ASRock Z790 Taichi Carrara paints a very intriguing picture.
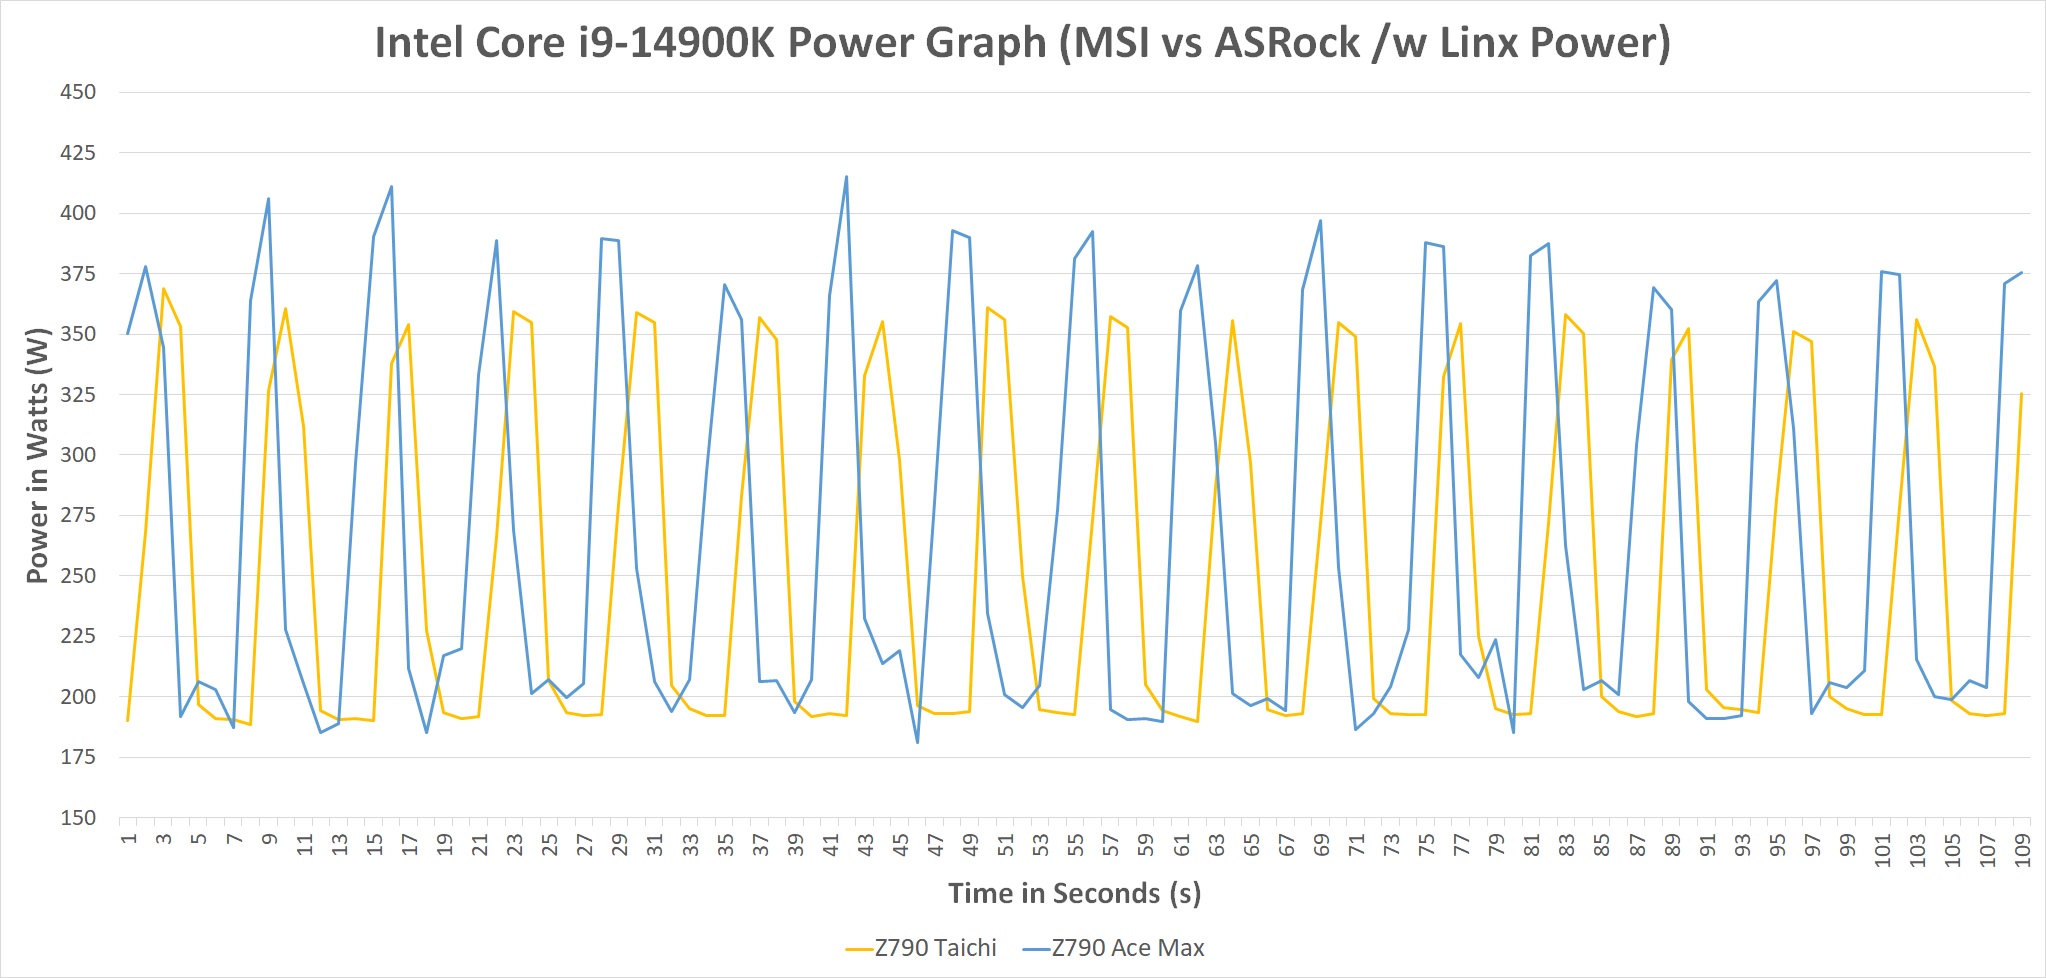
Analyzing the data between the data we observed from both Z790 motherboards, we can see that in Linx, the MSI MEG Z790 Ace Max is drawing consistently more power during the spikes. Both using the same Intel Core i9-14900K sample, the Z790 Ace Max is drawing upwards of 415 W during our Linx testing, whereas the Z790 Taichi Carrara motherboard is drawing less than 375 W at full load. This not only shows that the MSI board is pumping much more power from the power supply but that the ASRock board is still outputting a considerable amount of power, albeit less than 400 W compared to MSI.
We believe that the firmware on the MSI MEG Z790 Ace Max is likely the issue here and is what has caused eyewatering levels of power consumption, especially during intensive compute workloads.
Productivity and Web
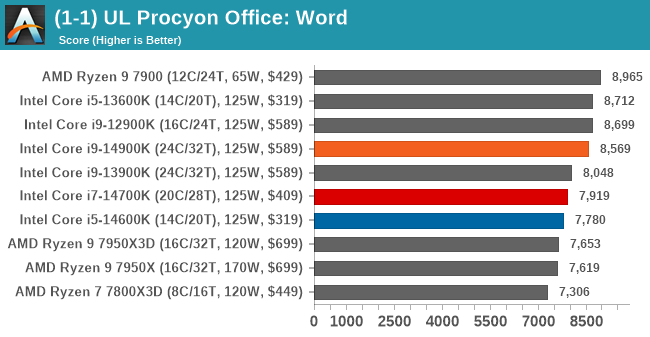
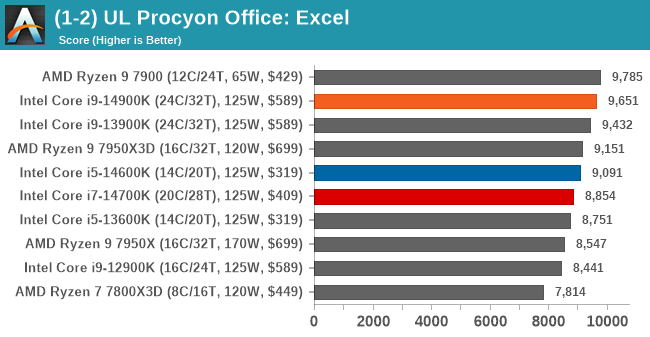
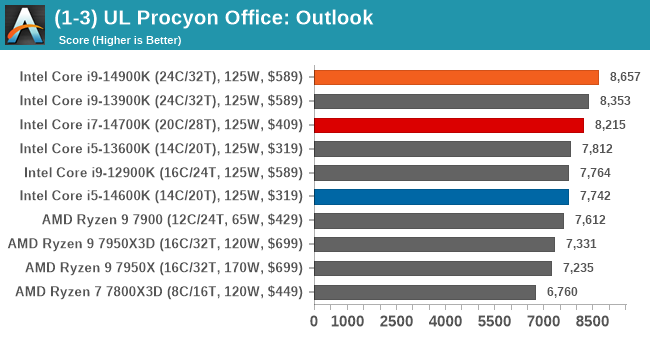
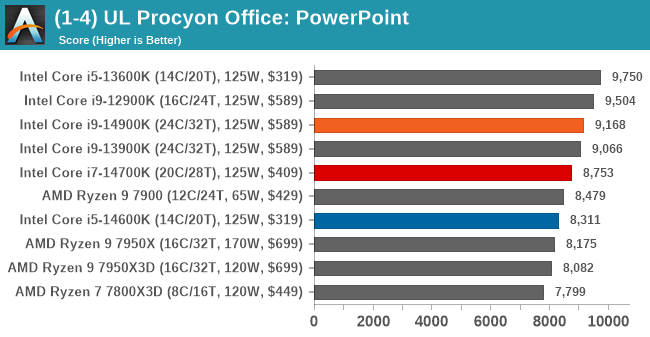
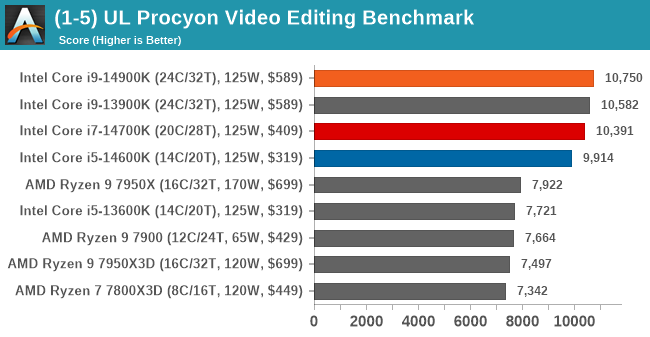
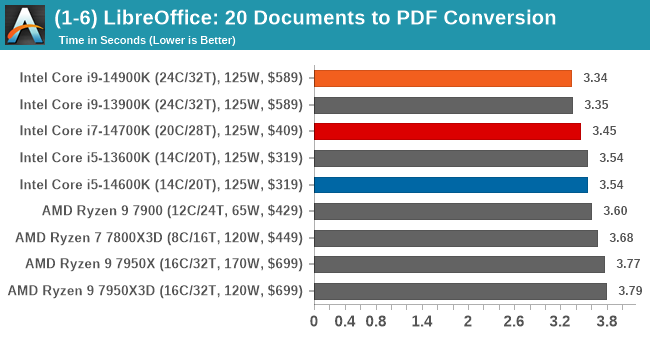
In our office and productivity suite, the Intel Core i9-14900K and the Core i9-13900K consistently trade blows. The real surprise is the Core i7-14700K, which, given it only has four fewer E-cores than both Core i9s, is consistently up there in terms of performance. Looking at how the Core i5-14600K compares against the previous Core i5-13600K, the newer 14th Gen Core i5 is consistently ahead, but only marginally.


57 Comments
View All Comments
cmdrdredd - Wednesday, October 18, 2023 - link
You aren't even the target market for any of this so your comment is useless and pointless. You are not an enthusiast, gamer, or need the power for work.ItsAdam - Wednesday, October 18, 2023 - link
I old a 4090 and I wouldn't want a CPU with the same power as it. I was waiting for Meteor Lake upgrading from my 5800X3D, but when I heard it was a refresh I was like oh no.Looks like I'm going to be a beta tester for AMDs 6000 series, and I'm quite frankly bored of AMD and it's crash test consumer development.
I know times are changing, I know, and I loved to tinker but it's getting too long in the tooth with AMD ATM with all the agesa "fixes" which is usually a big performance loss.
I really wanted INTEL to come out brawling,but all they're doing is digging their own grave.
They shouldn't have released ANOTHER refresh, especially one as bad as this.
lilo777 - Wednesday, October 18, 2023 - link
You do not pay the utility for peak power consumption. You pay for actual consumption which is much lower because power peaks are rare and short.mode_13h - Wednesday, October 18, 2023 - link
> power peaks are rare and short.Depends on what you're doing. If rendering, video encoding, or lots of software compilation, then not necessarily.
mode_13h - Wednesday, October 18, 2023 - link
Thanks for continuing to run SPEC2017, but I'm really missing the cumulative scores. Also, I wish we could get cumulative scores on E-cores only and P-cores only, as well as populating that graph with some other popular CPUs, as was done up to the i9-12900K review.For reference, please see the chart titled "SPEC2017 Rate-N Estimated Total", at the bottom of this page:
https://www.anandtech.com/show/17047/the-intel-12t...
The following page of that review goes on to explore the P & E cores.
Perhaps this would be good material for a follow-on article?
eloyard - Thursday, October 19, 2023 - link
2000s called, want their Net-Burst back.Reinforcer - Saturday, October 28, 2023 - link
Then don't let the motherboard run away with power lol, Honestly what is wrong with you reviewers fixated on how much power it can draw? Set it to Intel's 253w limit and enjoy almost the same performance as one that is consuming stupid amounts of power, It's not rocket science or do we not know how to set a motherboard up these days?