Fall '06 NVIDIA GPU Refresh - Part I: GeForce 7900 GS
by Derek Wilson on September 6, 2006 9:00 AM EST- Posted in
- GPUs
Black & White 2 Performance
The AnandTech benchmark for Black & White 2 is a FRAPS benchmark. Between the very first tutorial land and the second land there is a pretty well rounded cut scene rendered in-game. This benchmark is indicative of real world performance in Black & White 2. We are able to see many of the commonly rendered objects in action. The most stressful part of the benchmark is a scene where hundreds of soldiers come running over a hill, which really pounds the geometry capabilities of these cards. At launch, ATI cards were severely out matched when it came to B&W2 performance because of this scene, but two patches applied to the game and quite a few Catalyst revisions later give ATI cards a much needed boost in performance over what we first saw.
A desirable average framerate for Black & White 2 is anything over 20 fps. The game does remain playable down to the 17-19 fps range, but we usually start seeing the occasional annoying hiccup during gameplay here. While this isn't always a problem as far as getting things done and playing the game, any jerkiness in frame rate degrades the overall experience.
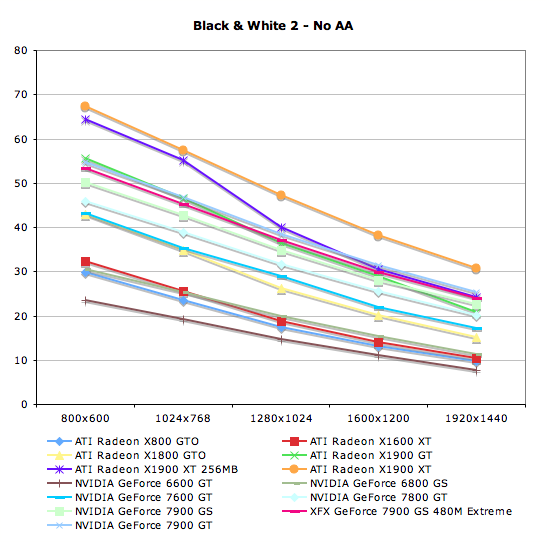
We did test with all the options on the highest quality settings under the custom menu. Antialiasing has quite a high performance hit in this game, and is generally not worth it at high resolutions unless the game is running on a super powerhouse of a graphics card. If you're the kind of person who just must have AA enabled, you'll have to settle for a little bit lower resolution than we tend to like on reasonably priced graphics card. Black & White 2 is almost not worth playing at low resolutions without AA, depth of field, or bloom enabled. At that point, we tend to get image quality that resembles the original Black & White. While various people believe that the original was a better game, no one doubts the superiority of B&W2's amazing graphics.
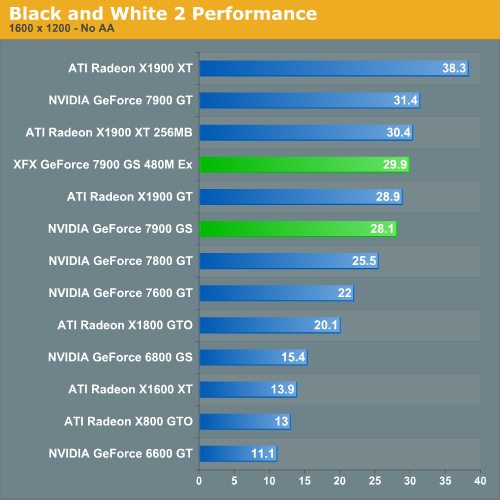
While spending $200 or more will earn you playable performance at up to 1920x1440 without AA under Black & White 2, the X1900 GT does fall a bit short due to its slightly higher price tag and slightly lower performance compared to the overclocked 7900 GS. As with Battlefield 2, the stock and overclocked 7900 GS parts mostly sandwich the performance of the X1900 GT. This is pretty impressive considering there is only about a 6% difference between the stock and XFX cards in the performance of most games.
| Black & White 2 - No AA | |||||
800x600 |
1024x768 |
1280x1024 |
1600x1200 |
1920x1440 |
|
| ATI Radeon X800 GTO | 29.9 |
23.5 |
17.4 |
13 |
9.7 |
| ATI Radeon X1600 XT | 32.3 |
25.5 |
18.7 |
13.9 |
10.3 |
| ATI Radeon X1800 GTO | 43 |
34.7 |
26.3 |
20.1 |
15.2 |
| ATI Radeon X1900 GT | 55.7 |
46.5 |
36.4 |
28.9 |
20.9 |
| ATI Radeon X1900 XT 256MB | 64.5 |
55.2 |
40.1 |
30.4 |
24.1 |
| ATI Radeon X1900 XT | 67.3 |
57.5 |
47.2 |
38.3 |
30.7 |
| NVIDIA GeForce 6600 GT | 23.5 |
19.2 |
14.7 |
11.1 |
7.7 |
| NVIDIA GeForce 6800 GS | 30.5 |
25.4 |
19.8 |
15.4 |
11.2 |
| NVIDIA GeForce 7600 GT | 43.1 |
35.3 |
28.9 |
22 |
17.2 |
| NVIDIA GeForce 7800 GT | 45.8 |
38.8 |
31.6 |
25.5 |
20.2 |
| NVIDIA GeForce 7900 GS | 50.2 |
42.7 |
34.9 |
28.1 |
22.5 |
| XFX GeForce 7900 GS 480M Extreme | 53.3 |
45.3 |
37.1 |
29.9 |
23.9 |
| NVIDIA GeForce 7900 GT | 54.8 |
46.8 |
38.5 |
31.4 |
25.2 |


29 Comments
View All Comments
munky - Wednesday, September 6, 2006 - link
FEAR is a DX9 game, not OpenGL...
DerekWilson - Wednesday, September 6, 2006 - link
I'm looking into this at the moment but having trouble finding documentation on it.I suppose, as I was recently testing quad sli and saw huge performance increases, I assumed the game must be using the 4 frame afr mode only possible in opengl (dx is limited to rendering 3 frames ahead). I'll keep looking for confirmation on this ...
MemberSince97 - Wednesday, September 6, 2006 - link
Jupiter EX is a DX9 rendering engine...DerekWilson - Wednesday, September 6, 2006 - link
corrected, thanks ... now I have to figure out why FEAR likes quad sli so much ...MemberSince97 - Wednesday, September 6, 2006 - link
Nice writeup DW, I really like the mouseover performance % graphs...PrinceGaz - Thursday, September 7, 2006 - link
So do I, but there is one errorThat should be 14% and 25% advantages
The 7900GS has 20 PS while the 7900GT has 24 PS. That makes the 7900GS 20% slower than the 7900GT, but it makes the 7900GT 25% faster than the 7900GS. It's important to remember which one you're comparing it against when quoting percentages.
Hopefully the percentage performance difference in the graph itself was calculated correctly, or at least consistently.
PrinceGaz - Thursday, September 7, 2006 - link
Ooops sorry, please ignore my post. For some reason I thought for a moment the 7900GS had 16 PS and the 7900GT had 20 PS (despite writing the correct values in my comment). The article is correct, I was just getting confused.PS. an edit function would be nice.
Frackal - Wednesday, September 6, 2006 - link
There is no way an X1900xt gets 75fps at 1600x1200 4xAA, at that same resolution and AA setting I get well over 120-130fps average with an X1900xtx. Most sites show it hitting at least 100+DerekWilson - Wednesday, September 6, 2006 - link
if you use the built in demo features to run a timedemo with dice's own calculations you will get a very wrong (skewed upward) number. Dice themselves say that results over 100 fps aren't reliable.the problem is that they benchmark the load screen, and generally one card or the other will get better load screen performance -- for instance, the x1900 gt may get 300+fps while the 7900 gt may only get 200fps. (I just picked those numbers, but framerates for the load screen are well over 100 fps in most cases and drastically different between manufacturers).
not only does no one care about this difference on a load screen, but it significantly interferes with benchmark numbers.
the timedemo feature can be used to output a file with frametimes and instantaneous frames per second. we have a script that opens this file, removes the frame data for the load screen, and calculates a more accurate framerate average using only frame data for scenes rendered during the benchmark run.
this will decrease over all scores.
we also benchmark in operation clean sweep which has a lot of fog and water. we use a benchmark with lots of smoke and explosions and we test for some ammount of time in or near most vehicles.
splines - Wednesday, September 6, 2006 - link
Ownage approved.