Beelink GTR7 mini-PC Review: A Complete AMD Phoenix Package at 65W
by Ganesh T S on August 24, 2023 8:00 AM ESTSystem Performance: Multi-Tasking
One of the key drivers of advancements in computing systems is multi-tasking. On mobile devices, this is quite lightweight - cases such as background email checks while the user is playing a mobile game are quite common. Towards optimizing user experience in those types of scenarios, mobile SoC manufacturers started integrating heterogenous CPU cores - some with high performance for demanding workloads, while others were frugal in terms of both power consumption / die area and performance. This trend is now slowly making its way into the desktop PC space.
Multi-tasking in typical PC usage is much more demanding compared to phones and tablets. Desktop OSes allow users to launch and utilize a large number of demanding programs simultaneously. Responsiveness is dictated largely by the OS scheduler allowing different tasks to move to the background. The processor is required to work closely with the OS thread scheduler to optimize performance in these cases. Keeping these aspects in mind, the evaluation of multi-tasking performance is an interesting subject to tackle.
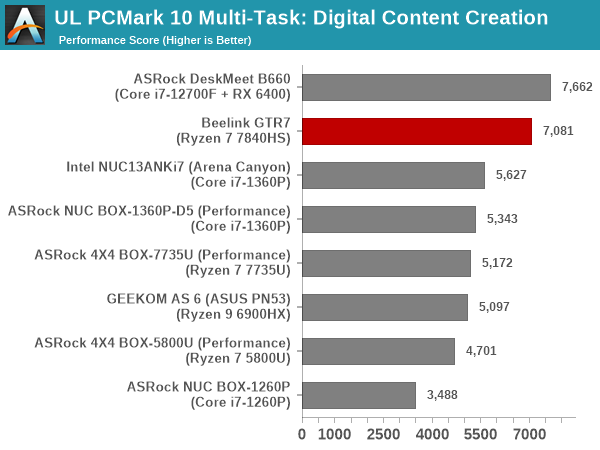
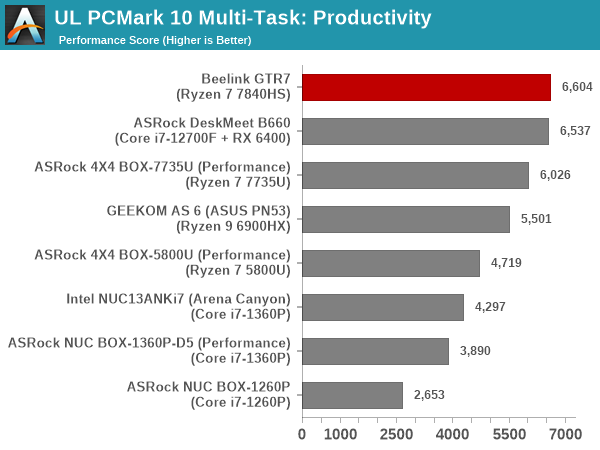
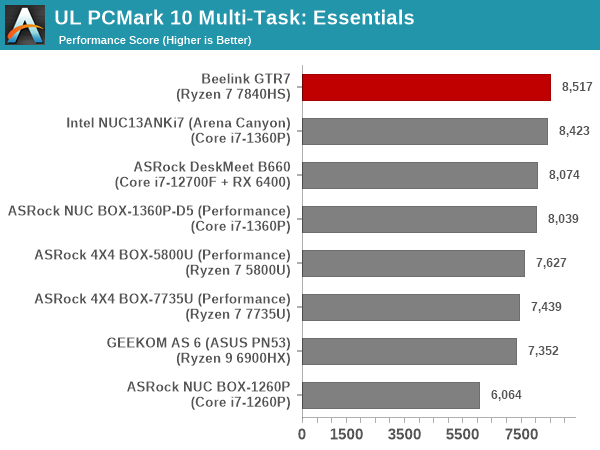
We have augmented our systems benchmarking suite to quantitatively analyze the multi-tasking performance of various platforms. The evaluation involves triggering a ffmpeg transcoding task to transform 1716 3840x1714 frames encoded as a 24fps AVC video (Blender Project's 'Tears of Steel' 4K version) into a 1080p HEVC version in a loop. The transcoding rate is monitored continuously. One complete transcoding pass is allowed to complete before starting the first multi-tasking workload - the PCMark 10 Extended bench suite. A comparative view of the PCMark 10 scores for various scenarios is presented in the graphs below. Also available for concurrent viewing are scores in the normal case where the benchmark was processed without any concurrent load, and a graph presenting the loss in performance.
| UL PCMark 10 Load Testing - Digital Content Creation Scores | |||
| UL PCMark 10 Load Testing - Productivity Scores | |||
| UL PCMark 10 Load Testing - Essentials Scores | |||
| UL PCMark 10 Load Testing - Gaming Scores | |||

| UL PCMark 10 Load Testing - Overall Scores | |||

Configuring the GTR7's Phoenix SoC at 65W gives it plenty of headroom to tackle multiple concurrent demanding workloads triggered by mainstream users (of the type benchmarked by PCMark 10). The GTR7 was already having leading performance in the absence of concurrent loading. Activation of such loads reduces the raw score, but the performance loss is less than the competition, and the GTR7 continues to remain on top.
Following the completion of the PCMark 10 benchmark, a short delay is introduced prior to the processing of Principled Technologies WebXPRT4 on MS Edge. Similar to the PCMark 10 results presentation, the graph below show the scores recorded with the transcoding load active. Available for comparison are the dedicated CPU power scores and a measure of the performance loss.
| Principled Technologies WebXPRT4 Load Testing Scores (MS Edge) | |||
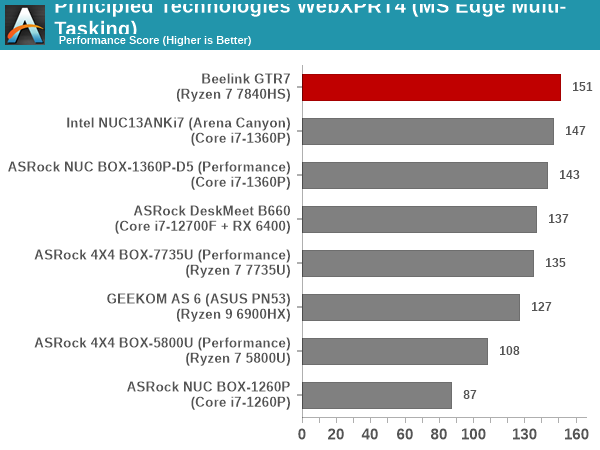
The observations made for the overall PCMark 10 scores continue to hold for WebXPRT 4 also. The GTR7 has the least performance loss, and that allows it to leapfrog the RPL-P systems in performance.
The final workload tested as part of the multitasking evaluation routine is CINEBENCH R23.
| 3D Rendering - CINEBENCH R23 Load Testing - Single Thread Score | |||

| 3D Rendering - CINEBENCH R23 Load Testing - Multiple Thread Score | |||
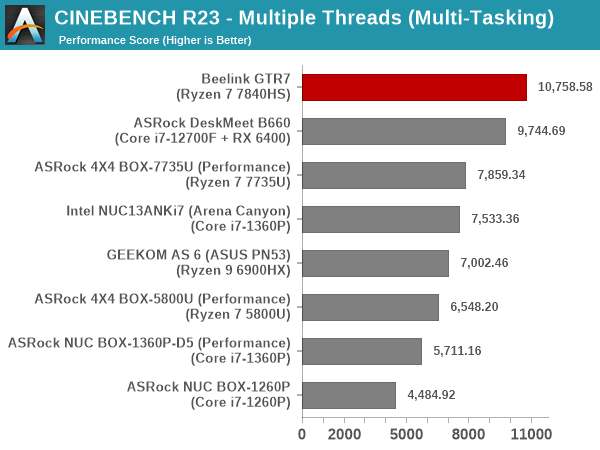
Intensive background tasks keep the efficiency cores busy, and take up some of the power budget. As a result, while the RPL-P systems came out on top in the absence of the background loads in single-threaded mode, the AMD-based systems manages to outwit them in raw scores after the introduction of the load. Multi-threaded performance continues to be a strongpoint of the GTR7, with the system coming out on top irrespective of the concurrent loading.
After the completion of all the workloads, we let the transcoding routine run to completion. The monitored transcoding rate throughout the above evaluation routine (in terms of frames per second) is graphed below.
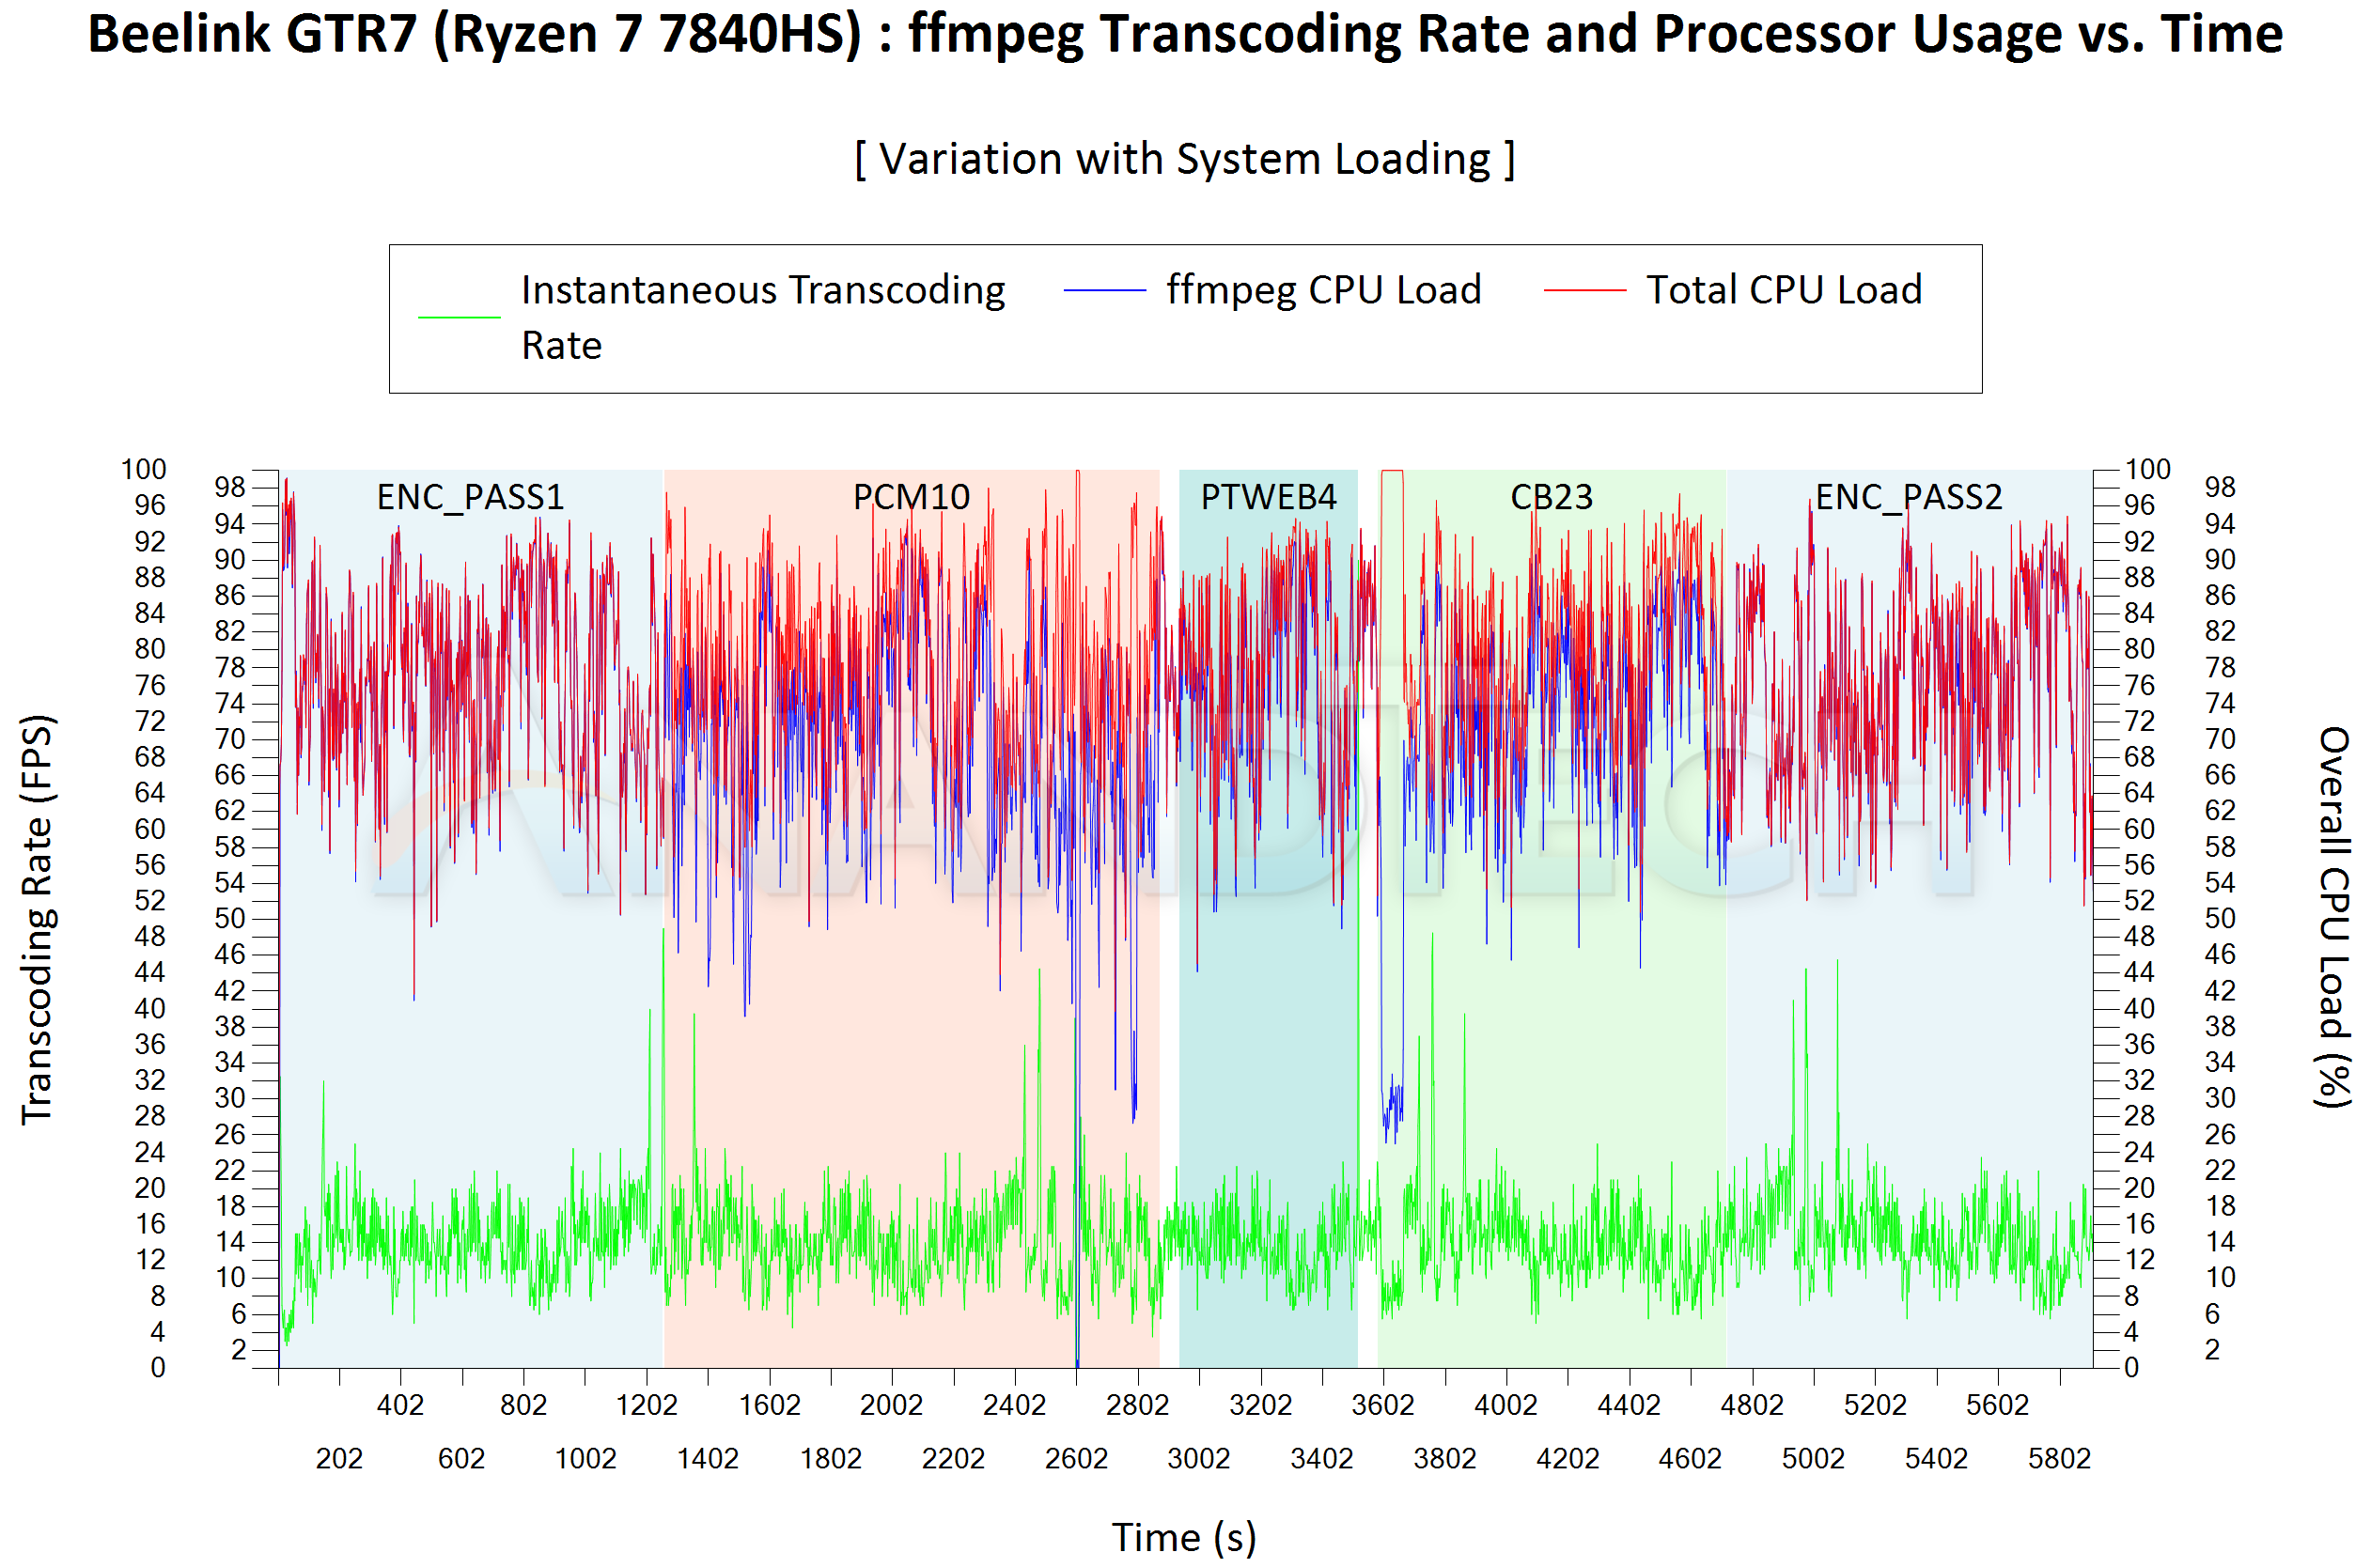
The transcoding rate during different segments is also recorded below.
| Beelink GTR7 (Ryzen 7 7840HS) ffmpeg Transcoding Rate (Multi-Tasking Test) |
|||
| Task Segment | Transcoding Rate (FPS) | ||
| Minimum | Average | Maximum | |
| Transcode Start Pass | 2.5 | 14.12 | 46.5 |
| PCMark 10 | 0 | 13.99 | 44.5 |
| WebXPRT 4 | 6.5 | 13.63 | 23 |
| Cinebench R23 | 5 | 13.78 | 48.5 |
| Transcode End Pass | 5.5 | 14.8 | 45.5 |
The comparison is against RPL-P systems such as the NUC BOX-1360P/D5. The GTR7 has a much lower delta in the transcoding rate between different task segments, but the power budget ensures that it doesn't translate to a lower primary workload score as seen in the graphs above. Overall, the RPL-P systems seem to prioritize foreground task better compared to AMD systems, but with the right power budget, the end user may not even notice the aspect.


56 Comments
View All Comments
darkswordsman17 - Friday, August 25, 2023 - link
Apple doesn't need to pay anyone, nor would they have someone posting in such a manner even if they did, let alone on a niche PC tech website that's long past its glory days.1_rick - Thursday, August 24, 2023 - link
"It's superior to this in just about every way."Not if I don't want to run MacOS.
StormyParis - Thursday, August 24, 2023 - link
The 7840hs seems to be- on par for single-core work
- 1.5 to 2x faster for multi-core
- 1.5x faster for graphics
- also it takes more and/or upgradeable RAM, storage, I/O, OSes...
https://nanoreview.net/en/cpu-compare/apple-m2-vs-...
Gm2502 - Sunday, August 27, 2023 - link
Are youj high, where in the world is a M2 faster then this 😂😂😂😂. All the benchmarks show this destroying M2 in every way, it can be upgraded, repaired and run windows. Another apple fanboy 😂😂😂bsd228 - Monday, August 28, 2023 - link
That 499 price is true for the basic model no one in their right mind wants, but the discount drops once you try to add on the other wants. The 16gb model is discounted 50, but that still makes it a $250 upgrade. If you want more disk, you're back to the 599 msrp plus the Apple charge. If you want 10gb over the weak 1gb, you're definitely paying msrp.The 5800u is a not quite at the 7840, but $350 for it with 32gb, 2x2.5gb and 500gb (replaceable) ssd is a much better docker box than the apple could ever hope to be.
BangkokTom - Tuesday, August 29, 2023 - link
...takes M2 mini apart, oh purposely bricked (this is a joke with Crapple's fix it yourself policy by the way)sjkpublic@gmail.com - Friday, September 1, 2023 - link
Ignore this person. Just a shil for the Apple monopoly.Threska - Thursday, August 24, 2023 - link
Kind of funny in a way. We've gone from obsessing with big computers to seeing how much computing we can squeeze into as small a space as possible.5080 - Thursday, August 24, 2023 - link
Would be nice to see a build quality review and comparison between this and the SimplyNUC (Moonstone), Morefine (M600), and MinisForum (UM790 Pro) NUC's.NextGen_Gamer - Thursday, August 24, 2023 - link
Yes! Also, I really want these guys to release them barebones, so I can put in my own RAM/SSD (without wasting money on the included ones). I got in touch with Morefine, and they told me they are no longer releasing the M600 barebones and only as a full kit now (if you check their website, you see this is true).