Beelink GTR7 mini-PC Review: A Complete AMD Phoenix Package at 65W
by Ganesh T S on August 24, 2023 8:00 AM ESTSystem Performance: UL and BAPCo Benchmarks
Our 2022 Q4 update to the test suite for Windows 11-based systems carries over some of the standard benchmarks we have been using over the last several years. While UL's PCMark makes the list, we have opted to temporarily suspend reporting of BAPCo's SYSmark scores (pending fixture of the energy consumption aspect). Instead, BAPCO's CrossMark multi-platform benchmarking tool has been added to the set along with UL's Procyon suite. While CrossMark employs idle time compression and processes all workloads in an opaque manner, UL's Procyon processes real-world workloads with user interactions (like BAPCo's SYSmark). We have augmented the UL Procyon suite benchmark with our own custom energy measurement setup.
UL PCMark 10
UL's PCMark 10 evaluates computing systems for various usage scenarios (generic / essential tasks such as web browsing and starting up applications, productivity tasks such as editing spreadsheets and documents, gaming, and digital content creation). We benchmarked select PCs with the PCMark 10 Extended profile and recorded the scores for various scenarios. These scores are heavily influenced by the CPU and GPU in the system, though the RAM and storage device also play a part. The power plan was set to Balanced for all the PCs while processing the PCMark 10 benchmark. The scores for each contributing component / use-case environment are also graphed below.
| UL PCMark 10 - Performance Scores | |||
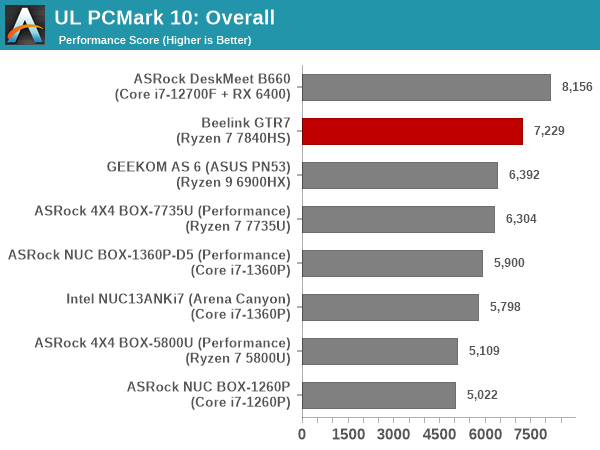
Discounting the DeskMeet B660, the GTR7 outscores the competition on the back of its lead in the productivity, gaming, and digital content creation workloads. The Essentials workload sees the Arena Canyon NUC enjoy a slight edge, but the sustained 65W configuration of the Ryzen 7 7840HS possesses way too much horsepower for the rest of the systems to match.
UL Procyon v2.1.544
PCMark 10 utilizes open-source software such as Libre Office and GIMP to evaluate system performance. However, many of their professional benchmark customers have been requesting evaluation with commonly-used commercial software such as Microsoft Office and Adobe applications. In order to serve their needs, UL introduced the Procyon benchmark in late 2020. There are five benchmark categories currently - Office Productivity, AI Inference, Battery Life, Photo Editing, and Video Editing. AI Inference benchmarks are available only for Android devices, while the battery life benchmark is applicable to Windows devices such as notebooks and tablets. We presents results from our processing of the other three benchmarks.
| UL Procyon - Office Productivity Scores | |||
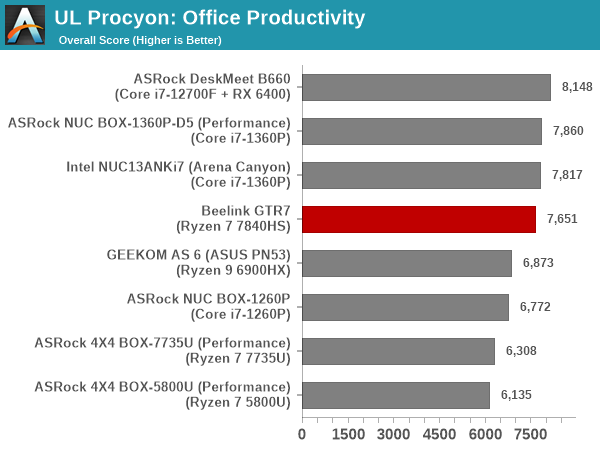
The GTR7 manages a narrow victory in the Powerpoint workload, but the NUCs based on the Core i7-1360P emerge with slightly better overall scores.

From an energy consumption viewpoint, the 4nm fabrication process for the Ryzen 7840HS seems to help the GTR7. While raw performance scores see it slightly behind the Raptor Lake-based systems, the absolute values are fairly similar. However, the GTR7 gets the job done with minimal power consumption, and as a result, lesser overall energy consumption.
Moving on to the evaluation of Adobe Photoshop and Adobe Lightroom, we find the GTR7 coming out with a slightly better score compared to the systems using the Core i7-1360P. The flow utilizes some of the iGPU functionality, and the improvements in the Radeon 780M show up here along with the higher sustained power budget. Interestingly, the photo editing workload was the one that refused to complete with GPU drivers supplied initially by Beelink, but AMD's first public driver release for Phoenix resolved the issue.
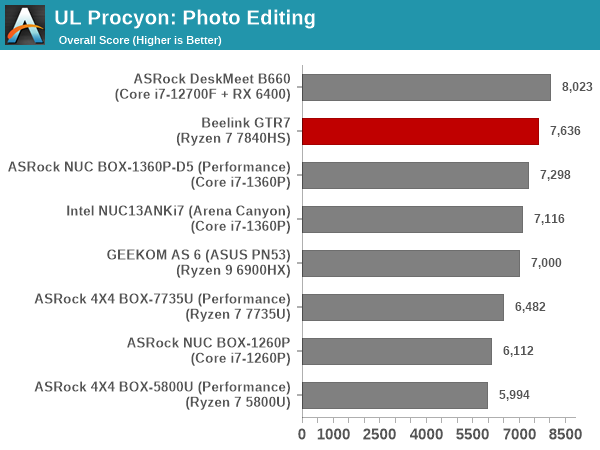
The energy efficiency of the Phoenix SoC again comes to fore here, with the GTR7 being the most energy efficient by a huge margin.

UL Procyon evaluates performance for video editing using Adobe Premier Pro.
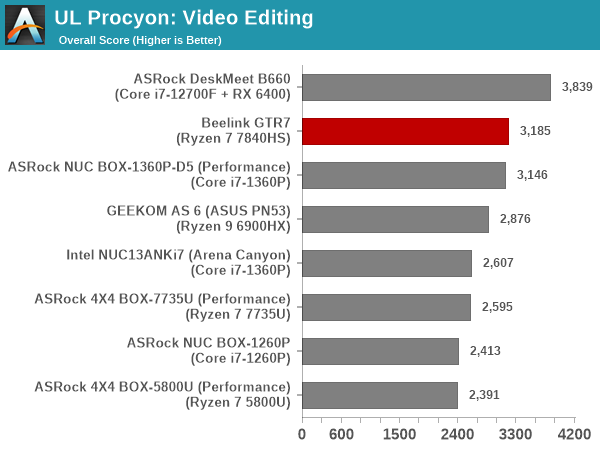
The GTR7 emerges as the best system among those not equipped with a discrete GPU. Its performance is within the realms of run-to-run variations with the souped up Core i7-1360P in ASRock Industrial's NUC BOX-1360P/D5.

On the energy front, the ability to get the job done fast helps in placing the GTR7 in the top half of the pack. The system comes second, falling slightly behind the ASRock Industrial NUC BOX-1360P/D5 with its CPU operating mode set to 'Performance' in the BIOS. However, similar to the raw performance scores, the gap is quite small.
BAPCo CrossMark 1.0.1.86
BAPCo's CrossMark aims to simplify benchmark processing while still delivering scores that roughly tally with SYSmark. The main advantage is the cross-platform nature of the tool - allowing it to be run on smartphones and tablets as well.
| BAPCo CrossMark 1.0.1.86 - Sub-Category Scores | |||
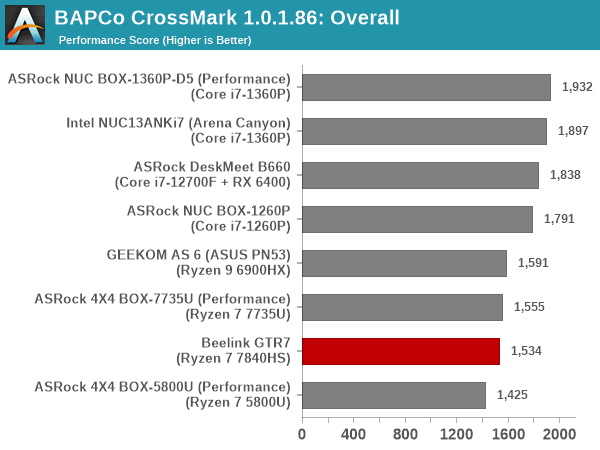
The use of idle time compression favors Intel-based systems, but that is not indicative of real-world performance. Based on these results, it would appear that scripting and automating workloads to keep the system busy all the time would probably be better on the Intel-based PCs. It is also possible that there could be BIOS tweaks and further tuning from Beelink to help the GTR7 perform better under such circumstances. Since CrossMark attempts to consolidate different workloads together without idle time intervals and play it back in a non-real-time environment, it is not entirely representative of real-world performance like PCMark 10 and UL Procyon. Therefore, tasks requiring frequent user interaction are better represented by those other benchmarks.


56 Comments
View All Comments
ActionJ26 - Friday, August 25, 2023 - link
Go with Minisforum um790 it is $519 barebonedhaplo602 - Monday, August 28, 2023 - link
that and tested as a SteamOS platform as well ...29a - Thursday, August 24, 2023 - link
"One of the interesting aspects of the I/O ports is the presence of an audio jack in both front and rear panels. Beelink has designed this in such a way that the connection of a headset of speakers to the rear jack automatically disables the front one."Does that mean you cant output different audio streams to both, for example game audio through the speakers in the back and chat audio through headphones on the front. Most MB allow this.
ganeshts - Thursday, August 24, 2023 - link
Can you give me some MB examples that allow this? I want to check their hardware audio path.As per Beelink's user manual, the disabling of the front jack is the expected behavior when the rear jack has a connected sink.
UserZ - Thursday, August 24, 2023 - link
Disabling the front jack seems really odd. I would have a pair of speakers connected to the rear jack as the default audio. When I occasionally plug in a headset to the front, I want to use that. I would hope that you could still choose which to use without unplugging anything in case I don't like their default behavior.darkswordsman17 - Friday, August 25, 2023 - link
Yeah I think it'd be preferable for the inverse (i.e. mute the rear when the front is detected), or for it to be able to be configured so it could do mic input from one with audio output from the other. Its probably easier for them to do this though. But then there's options if you use an external audio via USB (or probably Bluetooth as well).darkswordsman17 - Friday, August 25, 2023 - link
PC motherboards use separate audio chips for front and rear ports generally, and thus its easy for Windows/games to then be configured to output different for each one. I think there might be some external gaming audio boxes that could allow this as well (headset plugged in managing just chat whilst outputting game audio to speakers), so it could come down to drivers (or maybe it auto-configures).1_rick - Thursday, August 24, 2023 - link
The Crucial isn't a bad SSD if your needs align with it's capabilities. One place it completely falls down is large writes: I copied a ~60GB game to a Beelink SEI12 from a USB-C connected SSD, rather than let it be downloaded, and the pSLC cache was exhausted pretty quickly. At that point the performance tanked to somewhere around 40MBps, down about 90% from peak speed of about 500MBps.For normal day-to-day usage, you probably won't see much of a speed penalty, though.
NextGen_Gamer - Thursday, August 24, 2023 - link
@AnandTech: Were the 3DMark Port Royal benchmarks rerun on all of the older systems? Because the DeskMeet B660 system seems way off. The Radeon RX 6400 and Radeon 680M iGPU are actually the same in specs: RDNA-2, 12 Ray Accelerators, 32 ROPs, 48 TMUs, 768 Shading Units. It should, in theory, be RX 6400 just ahead of Ryzen 9 6900HX which in turn should be just ahead of Ryzen 7 7735U. And then the latest Ryzen 7 7840HUS, with its newer and higher-clocked RDNA-3 Radeon 780M iGPU, should be on top of the charts still.ganeshts - Thursday, August 24, 2023 - link
Unlike CPU or GPU reviews, for mini-PCs, we do not update the results in every review because most of the mini-PCs are loaner samples and go back to the manufacturer.The numbers presented in the graph for the Deskmeet B660 are from January 2023, using Adrenalin GPU drivers that were the latest in December 2022. FWIW, 3DMark also has online score submissions from different users searchable at www.3dmark.com/search
For RX 6400, Port Royal overall scores range from 126 to 558 (seems to depend on the CPU also), with an average of 252
For 680M, they range from 1081 to 1415 with an average of 1026.
In the above context, the scores we have graphed (427 and 1212) are entirely plausible.
It is also possible that recent driver releases might have improved scores, but our policy for mini-PC reviews is that we carry forward the scores from the time of the original review. Every few years, we purge the database and move to the latest versions of the benchmarks and also update the OS to the latest stable (for example, we are currently using Win 11 21H2 with the latest updates, but not 22H2). At that time, we choose a set of PCs that we still have in hand, re-bench them and use the newly obtained scores with the new benchmark version / OS for comparisons starting from that point onwards.