Investigations into Socket 939 Athlon 64 Overclocking
by Jarred Walton on October 3, 2005 4:35 PM EST- Posted in
- CPUs
RAM Latency
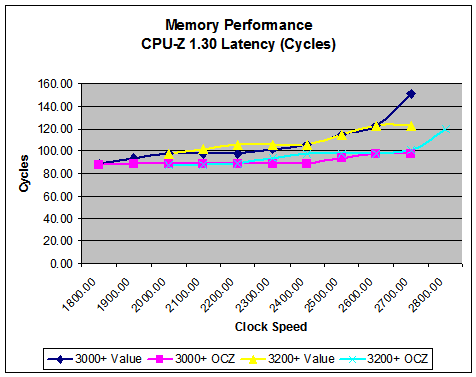
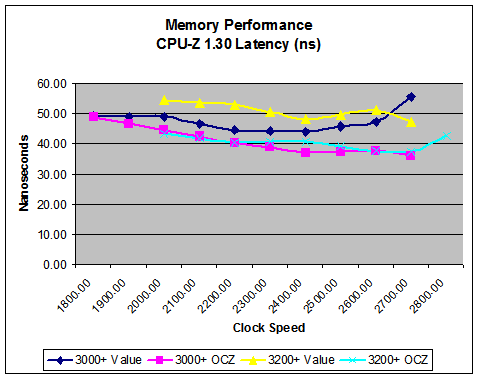
We talked about memory latency a bit before, and we estimated the total latency. Using CPU-Z and the included Latency.exe utility, we can get an actual real value for memory latency - or at least, more real than our estimate. There are different ways of measuring memory latency, but we simply took the highest reported value from the table that was generated. For every system, that value was in the bottom-right corner of the table, indicating a data set of 32MB and a stride of 512. While the values may or may not be entirely accurate, they should at least be consistently measured across all the tested configurations. Here are the results, in CPU cycles as well as nanoseconds. Remember that at higher CPU speeds, each cycle is faster, so pay more attention to the nanoseconds graph.
While the value RAM is clearly slower than the expensive RAM, the big question is: how much performance do you actually lose by opting for more economical RAM? This is one of the areas that we are interested in testing for this article, and we'll comment on the results throughout the benchmarks.
RAM Possibilities
One area of the BIOS that's missing (for now) is support for additional RAM ratios. The reality is that the RAM speed is derived from the CPU clock with a divider. Ideally, we'd like to see a BIOS that gives direct access to the CPU divider rather than hiding it behind approximate memory speeds. That would allow for the selection of a larger range of options, but we're not sure if that's something that AMD controls in the CPU or if the BIOS programmers can do this. Here's a list of the standard RAM Settings, CPU multipliers and the resultant memory dividers that were available in the Infinity BIOS.
We have a LanParty UT nF3 250Gb that includes support for many in-between options from DDR200 through DDR500. Some of the interesting inclusions are DDR240, DDR280, DDR300, DDR360, DDR440, and DDR500. (CPU-Z actually failed to report the divider on a couple of those settings, but the resultant RAM speed was still read properly.) While additional memory dividers on the high end won't really help tweakers looking to get the most from the TCCD, BH5, or CH5 RAM, they can be particularly useful when using value RAM. All you need to do is select the appropriate divider to get your RAM under DDR400 - assuming standard value RAM. That way, you wouldn't take as much of a performance hit by running something like 10x250 (2.5 GHz). You could select a 13X divider rather than the standard 15X divider.
Additional ratios can even be useful for tuning performance RAM. For example, OCZ VX would not run stable above DDR500 (10x250), and we had to use 2-3-3-8-1T timings even then. (The 3.2V limit of the motherboard was at least partially to blame.) Running at 10x270, we had to drop to DDR333 (CPU/12), which resulted in the RAM running at DDR450 rather than the DDR540 result that would have been required for the normal CPU/10 ratio. However, if we could have selected a CPU/11 ratio, we could have run the RAM at DDR490 and gained a bit more performance. The additional ratios aren't required, but they would be nice to have.
If the last two paragraphs didn't make sense, then you can guess why we don't get additional access to RAM dividers. Experienced users might know how to make use of the settings, but many people would simply get confused; a "Catch-22".
We talked about memory latency a bit before, and we estimated the total latency. Using CPU-Z and the included Latency.exe utility, we can get an actual real value for memory latency - or at least, more real than our estimate. There are different ways of measuring memory latency, but we simply took the highest reported value from the table that was generated. For every system, that value was in the bottom-right corner of the table, indicating a data set of 32MB and a stride of 512. While the values may or may not be entirely accurate, they should at least be consistently measured across all the tested configurations. Here are the results, in CPU cycles as well as nanoseconds. Remember that at higher CPU speeds, each cycle is faster, so pay more attention to the nanoseconds graph.
While the value RAM is clearly slower than the expensive RAM, the big question is: how much performance do you actually lose by opting for more economical RAM? This is one of the areas that we are interested in testing for this article, and we'll comment on the results throughout the benchmarks.
RAM Possibilities
One area of the BIOS that's missing (for now) is support for additional RAM ratios. The reality is that the RAM speed is derived from the CPU clock with a divider. Ideally, we'd like to see a BIOS that gives direct access to the CPU divider rather than hiding it behind approximate memory speeds. That would allow for the selection of a larger range of options, but we're not sure if that's something that AMD controls in the CPU or if the BIOS programmers can do this. Here's a list of the standard RAM Settings, CPU multipliers and the resultant memory dividers that were available in the Infinity BIOS.
| Standard AMD Memory Ratios | |||
| RAM Setting | CPU Multiplier | RAM Divider | True RAM Speed |
| DDR200 | 9X | CPU/18 | DDR200 |
| DDR266 | 9X | CPU/14 | DDR257 |
| DDR333 | 9X | CPU/11 | DDR327 |
| DDR400 | 9X | CPU/9 | DDR400 |
| DDR200 | 10X | CPU/20 | DDR200 |
| DDR266 | 10X | CPU/15 | DDR267 |
| DDR333 | 10X | CPU/12 | DDR333 |
| DDR400 | 10X | CPU/10 | DDR400 |
| DDR200 | 11X | CPU/22 | DDR200 |
| DDR266 | 11X | CPU/17 | DDR259 |
| DDR333 | 11X | CPU/14 | DDR314 |
| DDR400 | 11X | CPU/11 | DDR400 |
| DDR200 | 12X | CPU/24 | DDR200 |
| DDR266 | 12X | CPU/18 | DDR267 |
| DDR333 | 12X | CPU/15 | DDR320 |
| DDR400 | 12X | CPU/12 | DDR400 |
We have a LanParty UT nF3 250Gb that includes support for many in-between options from DDR200 through DDR500. Some of the interesting inclusions are DDR240, DDR280, DDR300, DDR360, DDR440, and DDR500. (CPU-Z actually failed to report the divider on a couple of those settings, but the resultant RAM speed was still read properly.) While additional memory dividers on the high end won't really help tweakers looking to get the most from the TCCD, BH5, or CH5 RAM, they can be particularly useful when using value RAM. All you need to do is select the appropriate divider to get your RAM under DDR400 - assuming standard value RAM. That way, you wouldn't take as much of a performance hit by running something like 10x250 (2.5 GHz). You could select a 13X divider rather than the standard 15X divider.
Additional ratios can even be useful for tuning performance RAM. For example, OCZ VX would not run stable above DDR500 (10x250), and we had to use 2-3-3-8-1T timings even then. (The 3.2V limit of the motherboard was at least partially to blame.) Running at 10x270, we had to drop to DDR333 (CPU/12), which resulted in the RAM running at DDR450 rather than the DDR540 result that would have been required for the normal CPU/10 ratio. However, if we could have selected a CPU/11 ratio, we could have run the RAM at DDR490 and gained a bit more performance. The additional ratios aren't required, but they would be nice to have.
If the last two paragraphs didn't make sense, then you can guess why we don't get additional access to RAM dividers. Experienced users might know how to make use of the settings, but many people would simply get confused; a "Catch-22".


101 Comments
View All Comments
intellon - Tuesday, October 4, 2005 - link
I understand how/why the memory quality is not too imoprtant (5-9% increase for 100 bucks = not worthy)What I AM unclear about is the cpu itself. Would all the cpu's based on venice hit a same ceiling. Or would a 3800+ reach a higher, more stable, cooler overclock than the 3200+? There is one line that mentions these two cpu's on the first page but no comment on how they would perform when overclocked. Does a 12x help over 9x? Also am I wrong in assuming that you picked 3200+ over 3000+ because of a higher multiplier?
And like people are asking... how bad/good are the other chips? How'll a San Diego 3500+ fare against a Venice 3500+? They're faster as stock, but can they match or exceed overclock performance of venice?
Questions questions questions...
The article was wicked though. I was skeptical about buying a cheaper RAM... but seeing how another $50 is not going to help, I'll save that money for something else.
gplracer - Tuesday, October 4, 2005 - link
Very nice article. It appears to be well thought out. Thanks for the time you spent on it. I would also be nice to have an article of this type with some of the more popular power supplies.I to have had several chips that would overclock such as:
P166 @ 200mhz lol
Celeron 300a @ 450mhz
Duron 600 @ 950mhz
Athlon 1700+ (DLTC3) @ 2374mhz
2600+ at 250x10= 2500mhz
There is no way you could add all of the cpus to the review. I look forward to overclocking a dual core athlon64.
PaBlooD - Tuesday, October 4, 2005 - link
Great Articule.. thanks for that great work.I actually have a A64 3200+ Winchester core with an Epox 9NDA3+ + 512 x2 ocz premier (crap ) and i only can get the procesor to 2150 mhz... i tried with safe memo times.. but nothing..are that bad overclockers the Winchester cores? :S
(excuse my poor english ^_^)
RaulAssis - Wednesday, December 21, 2005 - link
Didi you try memory deviders like 5/6 ?yacoub - Tuesday, October 4, 2005 - link
I definitely appreciate all the walk-through of overclocking an A64 system. Very good article. One thing though - the last few pages with the test result charts... the charts make it look like the entire notion of overclocking is rather pointless since all four colored lines are nearly identical in all but a couple tests. You might want to consider a different type of chart next time that gives a -visual- impression of the benefit to better support the written descriptive increases in performance. Maybe some sort of bar chart would have worked better.JarredWalton - Tuesday, October 4, 2005 - link
I felt the visual impression conveyed exactly what I saw: the difference between the 3000+ and 3200+ in overclocking combined with value and performance RAM is, at best, small. I understand what you're saying, and trust me: I played around with the Excel graphs for many hours. None of the graphs really gave a clear picture, unfortunately. Getting four setups with about 9 settings each into a single chart is messy. Having 80 charts is even worse. Heheh.If someone can show me a preferred chart style, I'll be happy to change the graph for the next installment. The AnandTech graphing engine really wasn't capable of dealing with this type of data set, unfortunately... but Excel was only marginally better.
intellon - Tuesday, October 4, 2005 - link
I guess you could "ZOOM IN" onto the y-axis. For instance: on the last graph HL2 1024x768 4xAA, since the minimum was above 80 and max was below 140, you could set the min and max ranges of y-axis accordingly. or go GNU plot way for a sharper graph.JarredWalton - Tuesday, October 4, 2005 - link
Like the 3DMark GPU scores? I really dislike graphs that don't start at 0, because it hides the reality. (That's why I put the extra paragraph on the 3DMark scores noting specifically that they don't start at 0.) I can blow up a graph so that everyone can see the 1 or 2% margin of victory, but what does that really say? Margin of error on several benchmarks is at least 1 or 2%, and in actual use I don't think anyone will really notice even a 5% difference - I know I don't.Some people will be annoyed by this, but too many people worry about the last 1% of performance. Not because they can notice a difference, but because they want meaningless bragging rights. Sitting in the top positions in an online game requires skill. Getting 1% higher FPS usually just involves throwing more money at your PC than the next guy. Some people like to do that - sort of like some people like muscle cars. I want a fast computer, but I'm not going to lose sleep because my PC is marginally slower than my friend's, you know?
Anyway, I may look into a separate graphing tool. Excel looks fine internally, but getting the graphs into image form didn't work perfectly. The text alignment got a little tweaked when I cut and pasted the data into Photoshop.
Regards,
Jarred Walton
RupertS - Wednesday, October 19, 2005 - link
Be careful, I think Muscle Car owners are a protected class.probedb - Tuesday, October 4, 2005 - link
I'd just like to say cheers for this. It's made me finally get round to trying to OC my system. I purposely bought a 3000+ and Crucial Ballistix for this but have never got round to trying it.I shall give it a go this weekend!!!