Investigations into Socket 939 Athlon 64 Overclocking
by Jarred Walton on October 3, 2005 4:35 PM EST- Posted in
- CPUs
Application Performance
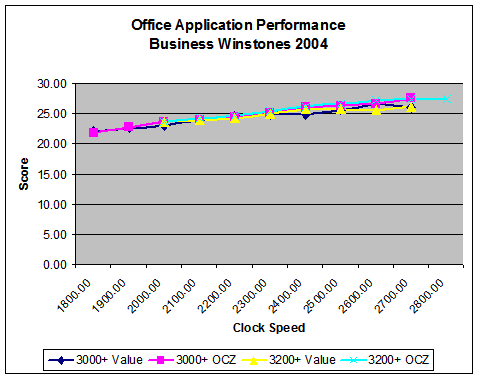
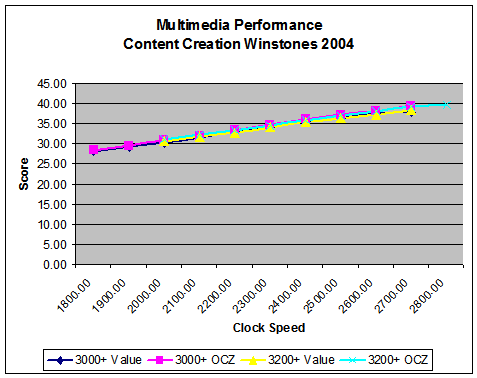
We'll start with some general application performance, courtesy of Winstones 2004. Winstones runs a bunch of scripts in a variety of real-world applications. The problem is that many of the scripts simulate user input and operate at speeds that no human can approach. Rendering an image, encoding audio or video, etc. can take time. Word, Excel, and Outlook, on the other hand, are almost entirely user-limited. While the fastest systems do perform higher, in every day use the typical office applications are going to run so fast that differentiating between the various overclocked settings is difficult, if not impossible.
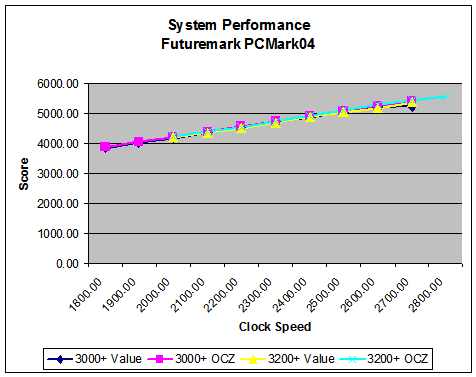
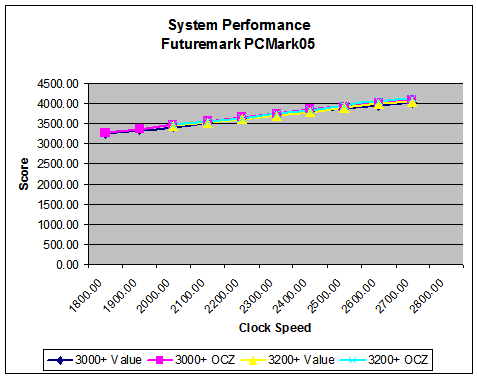
Similar in some ways to Winstones performance, PCMark attempts to gauge system performance. The results are a little more theoretical, as PCMark takes 5 to 10 minutes to run compared to 20 to 30 minutes for the Winstones tests. PCMark also includes some 2D and 3D graphics tests, which make the GPU somewhat important to the overall score. With Windows Vista moving to more hardware acceleration for windowing tasks, though, that's not necessarily a bad thing.
In case the graphs don't convey this fact well enough, our standard application scores benefited very little from the use of higher quality RAM. While the 2T command rate on the 9x300 value configuration did worse than the 9x289 value configuration, nearly all of the other tests show increasing performance, even with slightly lower memory speeds and latencies. The biggest gap between the value and performance RAM was in Business Winstones at 2.4 GHz, and even then, it was only a 5% margin of victory.
We'll start with some general application performance, courtesy of Winstones 2004. Winstones runs a bunch of scripts in a variety of real-world applications. The problem is that many of the scripts simulate user input and operate at speeds that no human can approach. Rendering an image, encoding audio or video, etc. can take time. Word, Excel, and Outlook, on the other hand, are almost entirely user-limited. While the fastest systems do perform higher, in every day use the typical office applications are going to run so fast that differentiating between the various overclocked settings is difficult, if not impossible.
Similar in some ways to Winstones performance, PCMark attempts to gauge system performance. The results are a little more theoretical, as PCMark takes 5 to 10 minutes to run compared to 20 to 30 minutes for the Winstones tests. PCMark also includes some 2D and 3D graphics tests, which make the GPU somewhat important to the overall score. With Windows Vista moving to more hardware acceleration for windowing tasks, though, that's not necessarily a bad thing.
In case the graphs don't convey this fact well enough, our standard application scores benefited very little from the use of higher quality RAM. While the 2T command rate on the 9x300 value configuration did worse than the 9x289 value configuration, nearly all of the other tests show increasing performance, even with slightly lower memory speeds and latencies. The biggest gap between the value and performance RAM was in Business Winstones at 2.4 GHz, and even then, it was only a 5% margin of victory.


101 Comments
View All Comments
DonTrowbridg3 - Thursday, October 4, 2018 - link
2018 checking in. Thanks for all the info and comments. Very helpful in overclocking my FX-60, A8N32-SLI, dual 8800 GTX