Intel Core i9-13900K and i5-13600K Review: Raptor Lake Brings More Bite
by Gavin Bonshor on October 20, 2022 9:00 AM ESTSPEC2017 Single-Threaded Results
SPEC2017 is a series of standardized tests used to probe the overall performance between different systems, different architectures, different microarchitectures, and setups. The code has to be compiled, and then the results can be submitted to an online database for comparison. It covers a range of integer and floating point workloads, and can be very optimized for each CPU, so it is important to check how the benchmarks are being compiled and run.
We run the tests in a harness built through Windows Subsystem for Linux, developed by Andrei Frumusanu. WSL has some odd quirks, with one test not running due to a WSL fixed stack size, but for like-for-like testing it is good enough. Because our scores aren’t official submissions, as per SPEC guidelines we have to declare them as internal estimates on our part.
For compilers, we use LLVM both for C/C++ and Fortan tests, and for Fortran we’re using the Flang compiler. The rationale of using LLVM over GCC is better cross-platform comparisons to platforms that have only have LLVM support and future articles where we’ll investigate this aspect more. We’re not considering closed-source compilers such as MSVC or ICC.
clang version 10.0.0

clang version 7.0.1 (ssh://git@github.com/flang-compiler/flang-driver.git

 24bd54da5c41af04838bbe7b68f830840d47fc03)
-Ofast -fomit-frame-pointer

-march=x86-64

-mtune=core-avx2

-mfma -mavx -mavx2
Our compiler flags are straightforward, with basic –Ofast and relevant ISA switches to allow for AVX2 instructions.
To note, the requirements for the SPEC licence state that any benchmark results from SPEC have to be labeled ‘estimated’ until they are verified on the SPEC website as a meaningful representation of the expected performance. This is most often done by the big companies and OEMs to showcase performance to customers, however is quite over the top for what we do as reviewers.
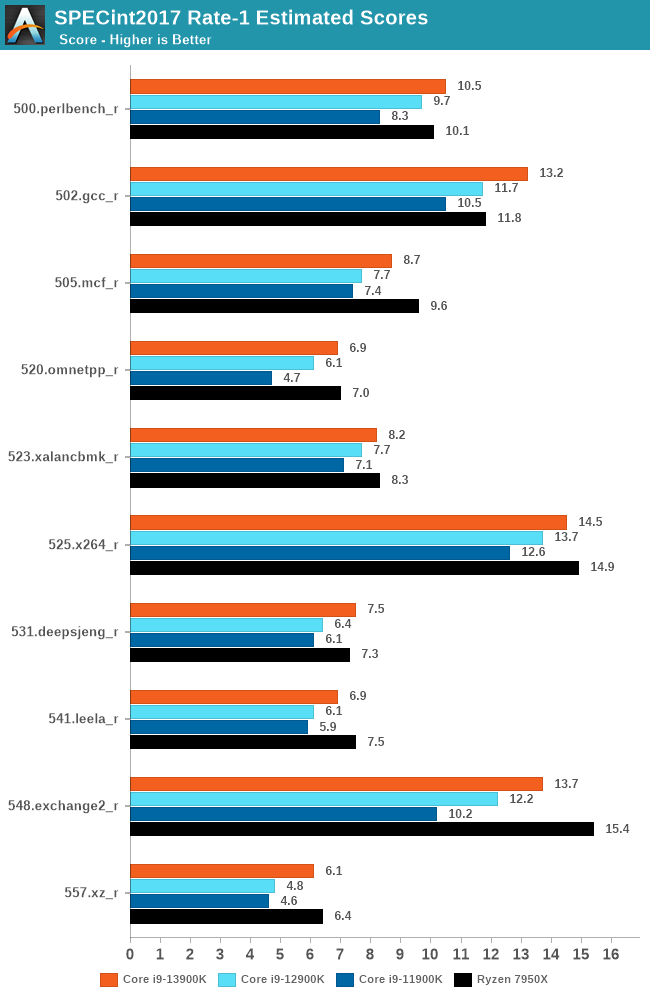
Opening things up with SPECint2017 single-threaded performance, it's clear that Intel has improved ST performance for Raptor Lake on generation-upon-generation basis. Because the Raptor Cove P-cores used here don't deliver significant IPC gains, these performance gains are primarily being driven by the chip's higher frequency. In particular, Intel has made notable progress in improving their v/f curve, which allows Intel to squeeze out more raw frequency.
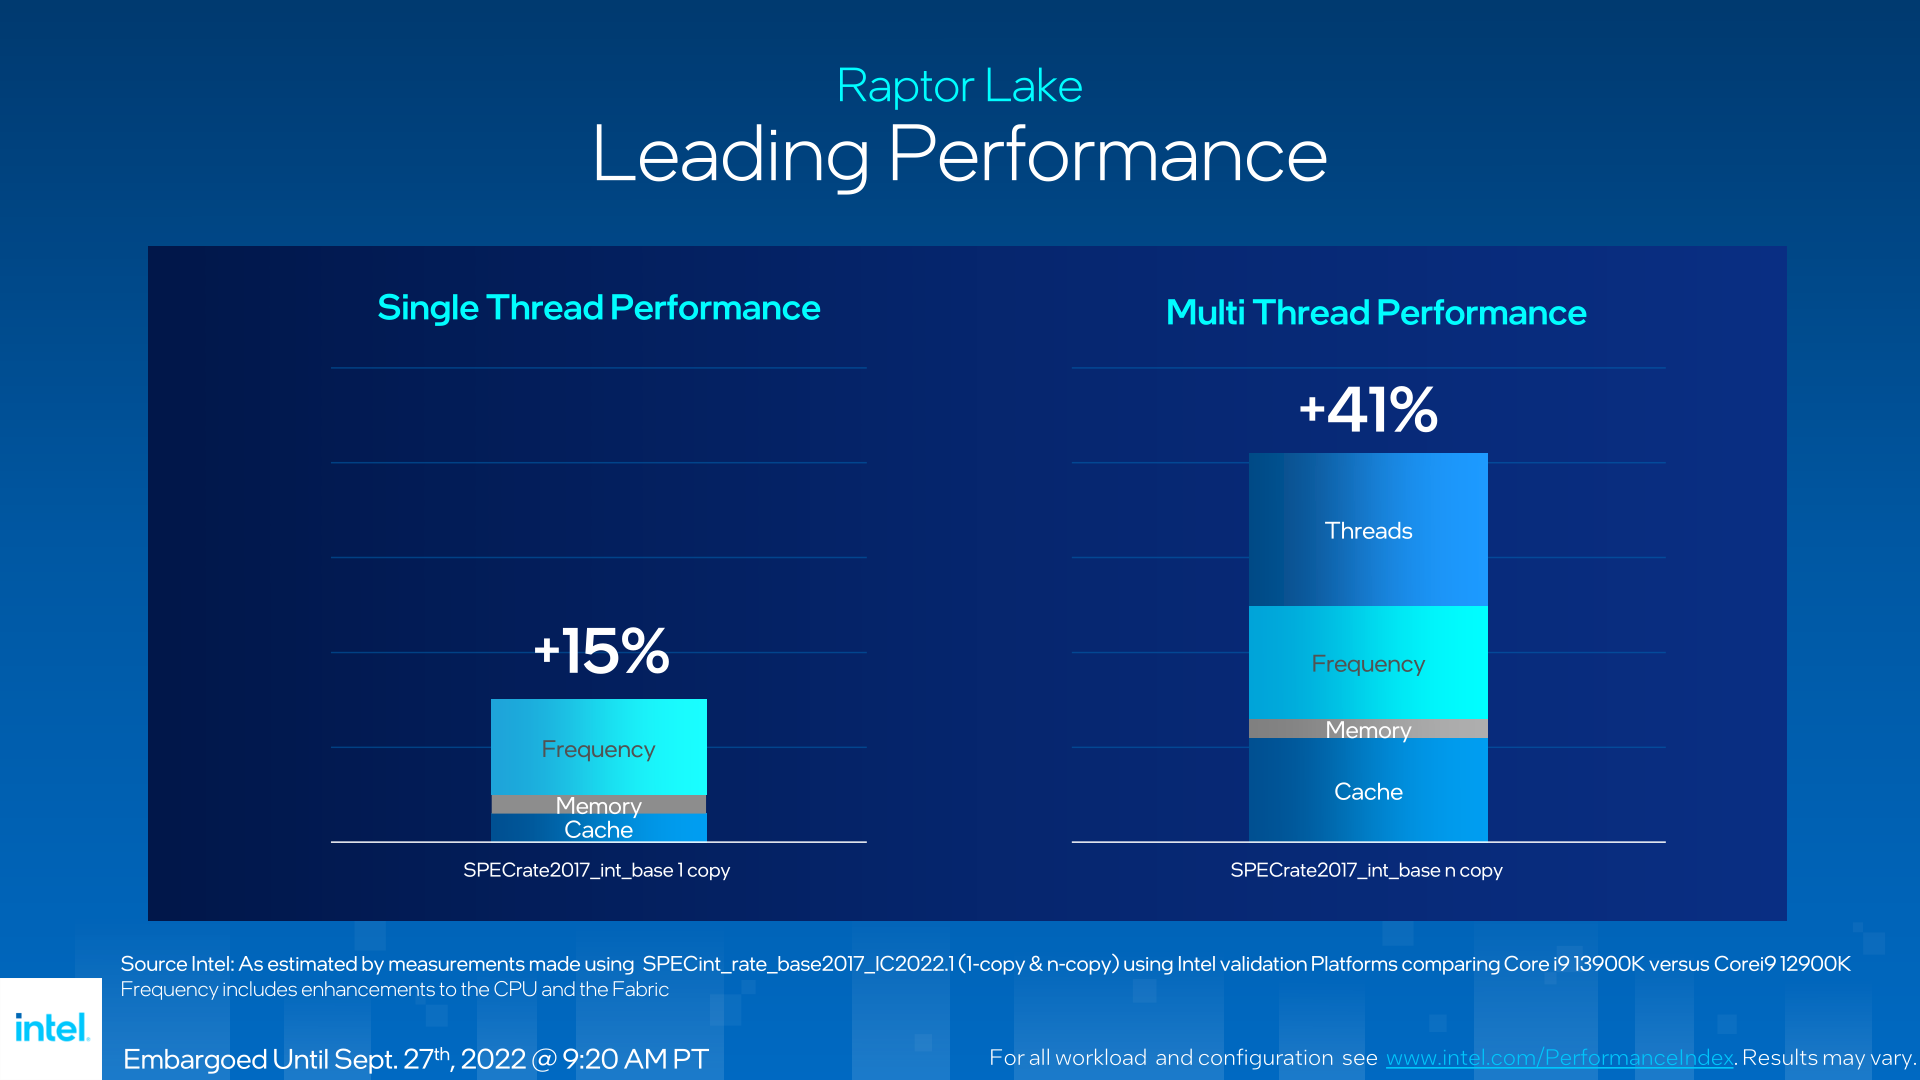
And this is something Intel's own data backs up, with one of Intel's performance breakdown slides showing that the bulk of the gains are due to frequency, while improved memory speeds and the larger caches only making small contributions.
The ST performance itself in SPECint2017 is marginally better going from Alder Lake to Raptor Lake, but these differences can certainly be explained by the improvements as highlighted above. What's interesting is the performance gap between the Core i9-13900K and the Ryzen 9 7950X isn't as far apart as it was with Alder Lake vs. Ryzen 9 5950X. In 500.perlbench_r, the Raptor Lake chip actually outperforms the Zen 4 variant by just under 4%, while Ryzen 9 7950X is a smidgen over 10% better in the 505.mcf_r test.
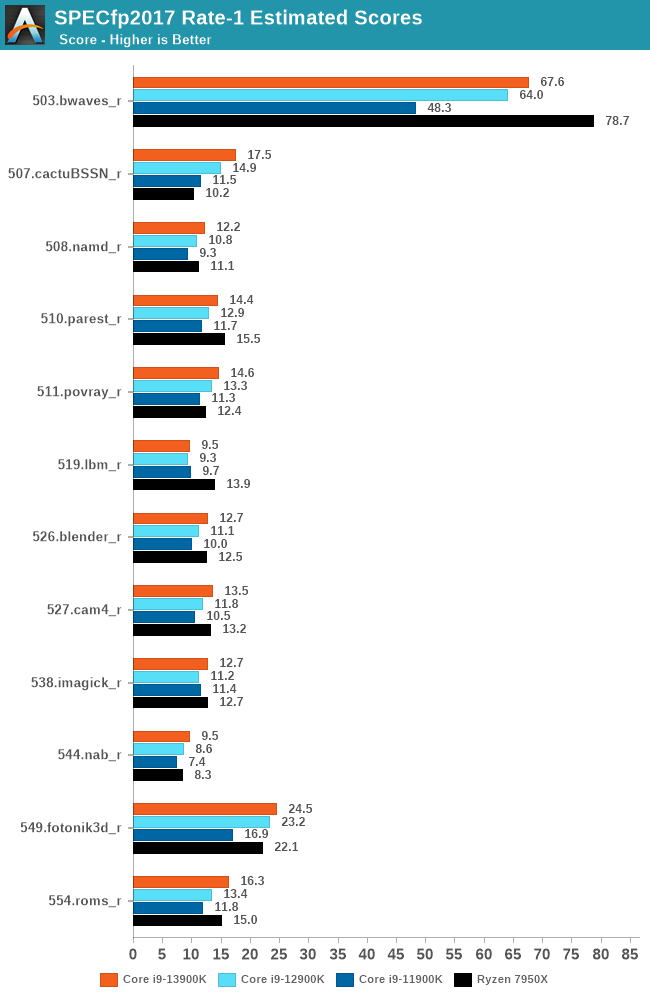
Looking at the second set of SPEC2017 results (fp), the Ryzen 9 7950X is ahead of the Core i9-13900K by 16% in the 503.bwaves_r test, while the Raptor Lake chip is just under 10% better off in the 508.namd_r test. The key points to digest here is that Intel has done well to bridge the gap in single-threaded performance to Ryzen 7000 in most of the tests, and overall, it's a consistent trade-off between which test favors which mixture of architecture, frequency, and most importantly of all, IPC performance.
While we highlighted in our AMD Ryzen 9 7950X processor review, which at the time of publishing was the clear leader in single-core performance, it seems as though Intel's Raptor Lake is biting at the heels of the new Zen 4-core. In some instances, it's actually ahead, but stiff competition from elsewhere is always good as competition creates innovation.
With Raptor Lake being more of a transitional and enhanced core design that Intel's worked with before (Alder Lake), it remains to be seen what the future of 2023 holds for Intel's advancement in IPC and single-threaded performance. Right now, however SPEC paints a picture where it's pretty much neck and neck between Raptor Cove and Zen 4.


169 Comments
View All Comments
m53 - Thursday, October 20, 2022 - link
PCs are idle (or used for light browsing, reading bews, watching youtube or a movie, etc.) most of the time. Intel idles at around 12W due to E cores while AMD idles at around 45W which will make the energy consumption 4x. Replyt.s - Thursday, October 20, 2022 - link
idle around 45w? sources? My 5600G idle at 11W. others, around 7 s/d 17W. Replytitaniumrock - Thursday, October 20, 2022 - link
here is the source link https://www.youtube.com/watch?v=UNmpVvTUkJE&li... Replyt.s - Friday, October 21, 2022 - link
And where it states the AMD vs Intel watt vs watt? ReplyWrs - Friday, October 21, 2022 - link
A 5600g is a monolithic chip, just like the Intels. A 7600x or 7950x is a multi-chip module, though, with 2 or 3 modules, and the IOD idle is very substantial now with all the PCIe5 lanes. Bottom line Zen 4 is more efficient when doing major work, courtesy of being one process generation ahead, but Raptor Lake and Alder Lake idle lower. If you want low idle with Zen4, wait for the SoC variants like your 5600g. Replytygrus - Saturday, October 22, 2022 - link
They don't run constantly with at maximum power consumption in all workloads. They use less while gaming or more integer & less FP/AVX. Highest usage probably when they have a performance lead over the other. AMD can run at lower power limits & loose a few % in many cases. Replyneblogai - Thursday, October 20, 2022 - link
I was hoping for Ryzen 7000X iGPU benchmarks too. There are no proper comparisons of them vs Intel's 32EU iGPUs on the internet. Replynandnandnand - Thursday, October 20, 2022 - link
ETA Prime 7700X iGPU tests (no comparisons):https://www.youtube.com/watch?v=p4cwNn4kI6M (gaming)
https://www.youtube.com/watch?v=MnSVPM78ZaQ (emulation)
7600X vs. 12900 vs. 5700G
https://arstechnica.com/gadgets/2022/09/ryzen-7600...
All Zen 4 vs. 12900K vs. others
https://www.techpowerup.com/review/amd-ryzen-7-770...
It's similar to the UHD 770 in Alder Lake, sometimes a little better or worse. About half the performance of a 5700G which is impressive for 2 CUs.
UHD 770 in Raptor Lake gets +100 MHz across the board, so that could make a slight difference. Reply
neblogai - Thursday, October 20, 2022 - link
Thanks. I liked the ones on Techpowerup, as they include tests at 720p low, and tested more than a few titles. Part of my interest is the need to compare to Tomshardware 7950 iGPU results, which looked suspiciously low for the specs, and probably faulty: https://www.tomshardware.com/news/ryzen-7000-integ... ReplyCiccioB - Thursday, October 20, 2022 - link
About power consumption.I think it is completely useless to measure it when running a useless benchmark that you then don't even use to compare the relative performances to other CPUs.
It would be much worth having a measurement for some more useful (common?) benches, just to understand when a real work is applied how much the CPU is consuming and, related to the performances, understand how efficient it is.
Just think what the results would be if the CPU would be artificially limited (by BIOS/driver) in Prime95 bench: you would measure a much lower consumption that extrapolated for other tests, and you could just think the CPU is consuming a fraction of what is does. It's the same for the torture benches of GPUs. The max consumption in that test is useless to understand how much they really consume while gaming, and in fact, most of them are artificially limited or just hit the max TDP (which is again not a measure of power consumption).
If you don't want to provide the power consumption for most benches, at least use a bench that gives a comparable performance, so that (at least for that test) one can make a comparison of the efficiency. Reply