ASRock Industrial NUC BOX-1260P and 4X4 BOX-5800U Review: Alder Lake-P and Cezanne UCFF Faceoff
by Ganesh T S on August 5, 2022 8:15 AM EST- Posted in
- Systems
- AMD
- Intel
- UCFF
- Mini-PC
- ASRock Industrial
- Cezanne
- Alder Lake-P
System Performance: Multi-Tasking
One of the key drivers of advancments in computing systems is multi-tasking. On mobile devices, this is quite lightweight - cases such as background email checks while the user is playing a mobile game are quite common. Towards optimizing user experience in those types of scenarios, mobile SoC manufacturers started integrating heterogenous CPU cores - some with high performance for demanding workloads, while others were frugal in terms of both power consumption / die area and performance. This trend is now slowly making its way into the desktop PC space.
Multi-tasking in typical PC usage is much more demanding compared to phones and tablets. Desktop OSes allow users to launch and utilize a large number of demanding programs simultaneously. Responsiveness is dictated largely by the OS scheduler allowing different tasks to move to the background. Intel's Alder Lake processors work closely with the Windows 11 thread scheduler to optimize performance in these cases. Keeping these aspects in mind, the evaluation of multi-tasking performance is an interesting subject to tackle.
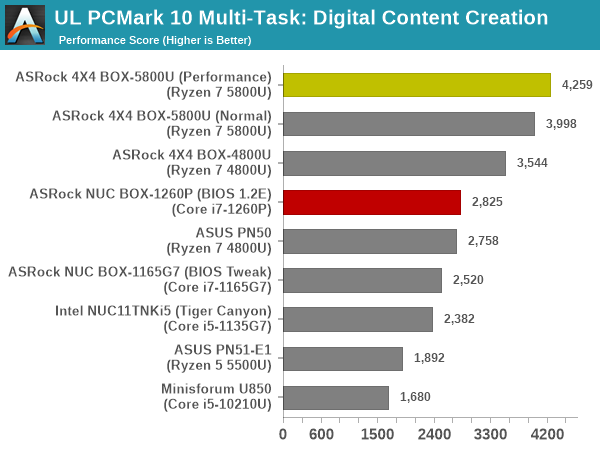
We have augmented our systems benchmarking suite to quantitatively analyze the multi-tasking performance of various platforms. The evaluation involves triggering a VLC transcoding task to transform 1716 3840x1714 frames encoded as a 24fps AVC video (Blender Project's 'Tears of Steel' 4K version) into a 1080p HEVC version in a loop. VLC internally uses the x265 encoder, and the settings are configured to allow the CPU usage to be saturated across all cores. The transcoding rate is monitored continuously. One complete transcoding pass is allowed to complete before starting the first multi-tasking workload - the PCMark 10 Extended bench suite. A comparative view of the PCMark 10 scores for various scenarios is presented in the graphs below. Also available for concurrent viewing are scores in the normal case where the benchmark was processed without any concurrent load, and a graph presenting the loss in performance.
| UL PCMark 10 Load Testing - Digital Content Creation Scores | |||
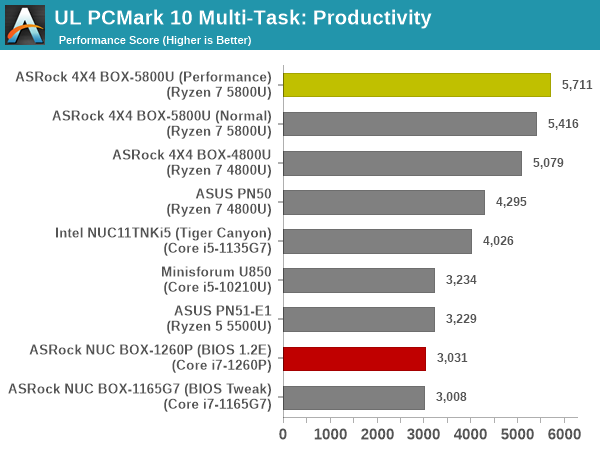
| UL PCMark 10 Load Testing - Productivity Scores | |||
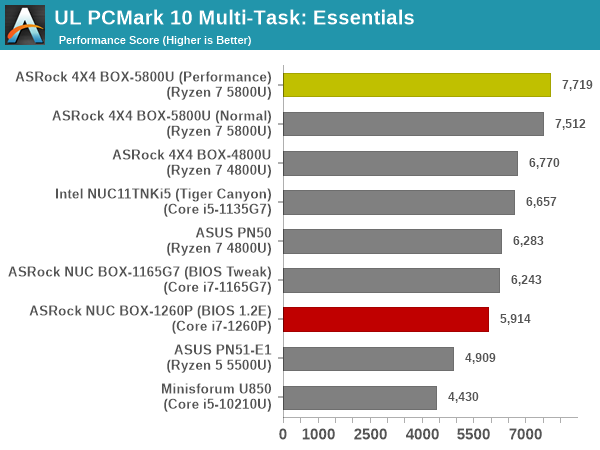
| UL PCMark 10 Load Testing - Essentials Scores | |||
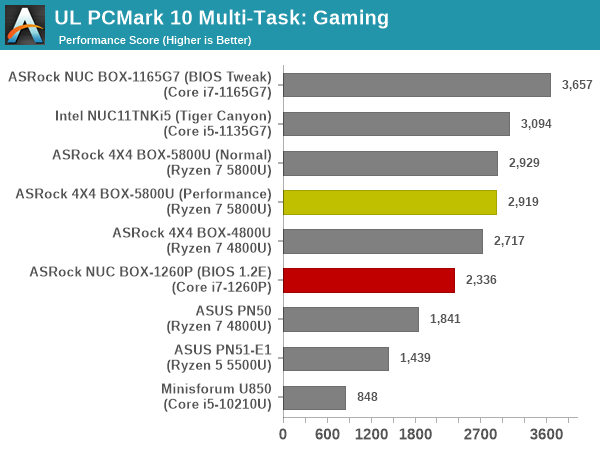
| UL PCMark 10 Load Testing - Gaming Scores | |||
| UL PCMark 10 Load Testing - Overall Scores | |||
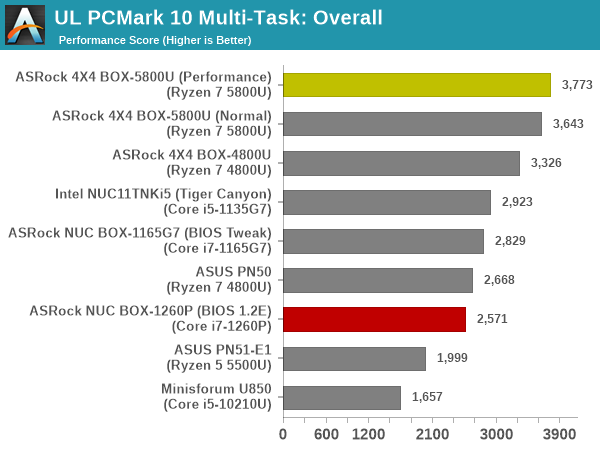
The Alder Lake system has an inauspicious beginning, falling way behind in a set of tests it is supposedly tuned for. Based on our experience with the system, it is a combination of having lesser number of performance cores compared to Cezanne, and a BIOS that has not been tuned carefully yet.
Following the completion of the PCMark 10 benchmark, a short delay is introduced prior to the processing of Principled Technologies WebXPRT4 on MS Edge. Similar to the PCMark 10 results presentation, the graph below show the scores recorded with the transcoding load active. Available for comparison are the dedicated CPU power scores and a measure of the performance loss.
| Principled Technologies WebXPRT4 Load Testing Scores (MS Edge) | |||
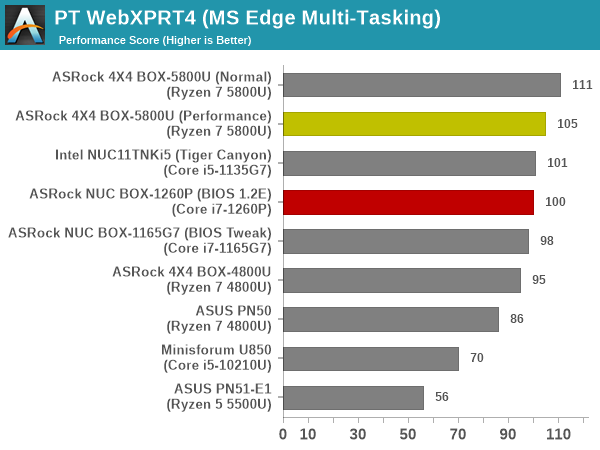
The performance of Alder Lake-P is slightly better here, but still not what we saw in other Alder Lake reviews.
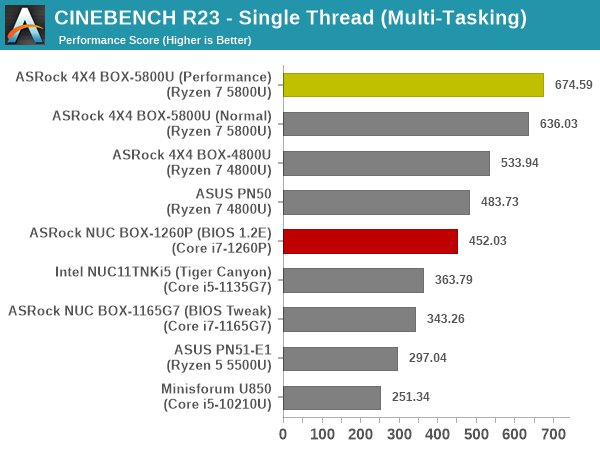
The final workload tested as part of the multitasking evaluation routine is CINEBENCH R23.
| 3D Rendering - CINEBENCH R23 Load Testing - Single Thread Score | |||
| 3D Rendering - CINEBENCH R23 Load Testing - Multiple Thread Score | |||
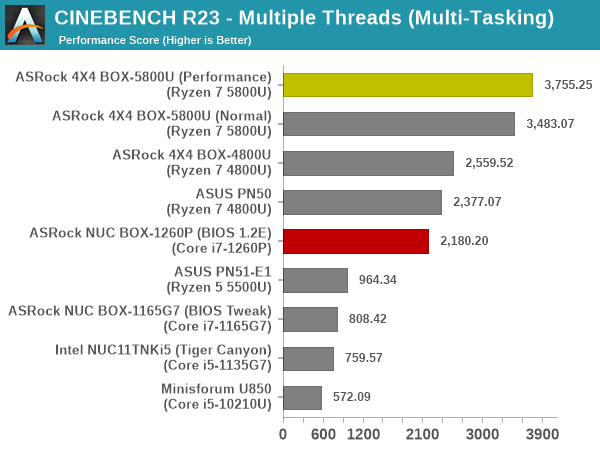
This is another dismal outing for the NUC BOX-1260P, with even the 1165G7 model having lesser performance loss.
After the completion of all the workloads, we let the transcoding routine run to completion. The monitored transcoding rate throughout the above evaluation routine (in terms of frames per second) for select systems are tabulated below.
| VLC Transcoding Rate (Multi-Tasking Test) - Frames per Second | |||||
| Enc. Pass #1 | PCMark 10 | WebXPRT4 | Cinebench | Enc. Pass #2 | |
| ASRock NUC BOX-1260P (Core i7-1260P ; BIOS 1.2E) |
1.2859 | 1.1608 | 1.1178 | 1.2515 | 1.2855 |
| ASRock 4X4 BOX-5800U (Ryzen 7 5800U ; Performance Mode) |
1.7057 | 1.5656 | 1.5053 | 1.7232 | 1.7086 |
| ASRock 4X4 BOX-5800U (Ryzen 7 5800U ; Normal Mode) |
1.6200 | 1.4950 | 1.4103 | 1.5672 | 1.6708 |
| ASRock 4X4 BOX-4800U (Ryzen 7 4800U) |
1.6366 | 1.5167 | 1.4080 | 1.5505 | 1.6073 |
| Intel NUC11TNBi5 (Akasa Newton TN) (Core i5-1135G7) |
0.8662 | 0.7773 | 0.7275 | 0.7773 | 0.8722 |
| ASRock NUC BOX-1165G7 (Core i7-1165G7) |
0.8409 | 0.8004 | 0.7230 | 0.7534 | 0.8854 |
The transcoding rates in different systems drop down with simultaneous loading, as expected. While the gap is least for the Alder Lake-P system, it comes at the cost of excessive performance loss in the concurrent workloads.


34 Comments
View All Comments
erotomania - Saturday, August 20, 2022 - link
Very nice writing, Ganesh. I enjoyed reading the whole article, and I perhaps most enjoyed the section on storage. I would read more, just sayin'.Oxford Guy - Sunday, August 21, 2022 - link
'Due to the variation in configured power limits for both processors, it is not possible to do a scientific apples-to-apples comparison for each benchmark.'And the differences between the SSDs.
Oxford Guy - Sunday, August 21, 2022 - link
Perhaps I missed it. Where is the decibel-to-performance data, or even a simple noise under tough real-world workload chart?stan_dman - Wednesday, August 24, 2022 - link
Impressive little pc's. I'd be interested how noisy the cooling is. I had an optiplex 7050 with i5-7500t (tdp 35w) gave me a headache with a whiny fan.