AMD's Ryzen 9 6900HS Rembrandt Benchmarked: Zen3+ Power and Performance Scaling
by Dr. Ian Cutress on March 1, 2022 9:30 AM ESTPerformance Per Watt
With the ASUS Zephyrus G14, it comes with some fancy ASUS software called the Armo(u)ry Crate. Inside is the usual array of options for a modern laptop when it comes to performance profiles, fans, special RGB effects and lighting, information about voltages, frequencies, fan speeds, fan profiles, and all that jazz. However inside the software there is also an interface that allows the user to cap how much APU/SoC power can be put through the processor or the whole platform.
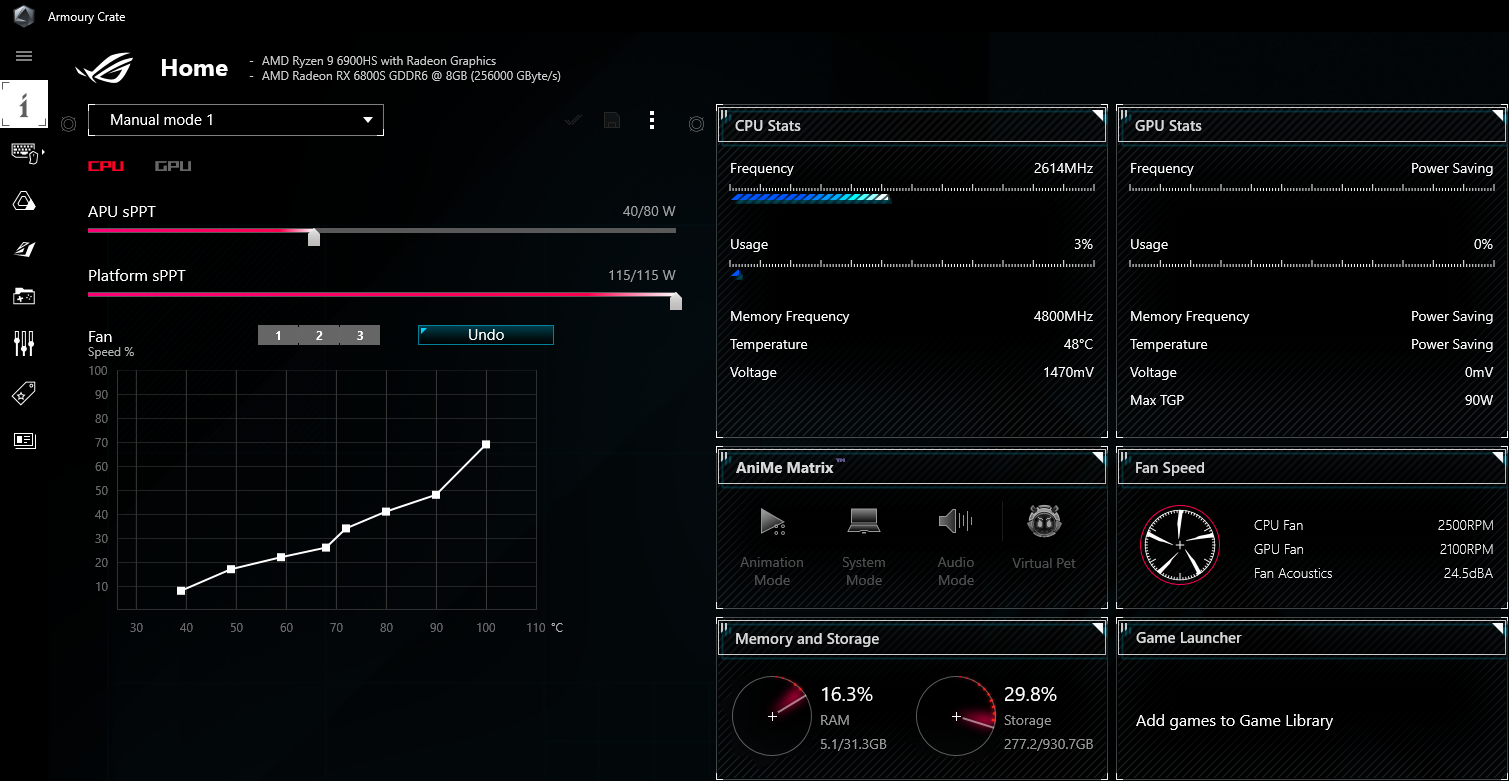
With this option, we took advantage of the fact that the after we select a given SoC wattage, the system will automatically migrate to the required voltage and frequency under load while only ever going up to the power limits - or as much as the system would be allowed to. Using this tool, we ran a spectrum of performance data against power options to see how the POV-Ray benchmark would scale, as it is one of the benchmarks that drives core use very high and very hard.
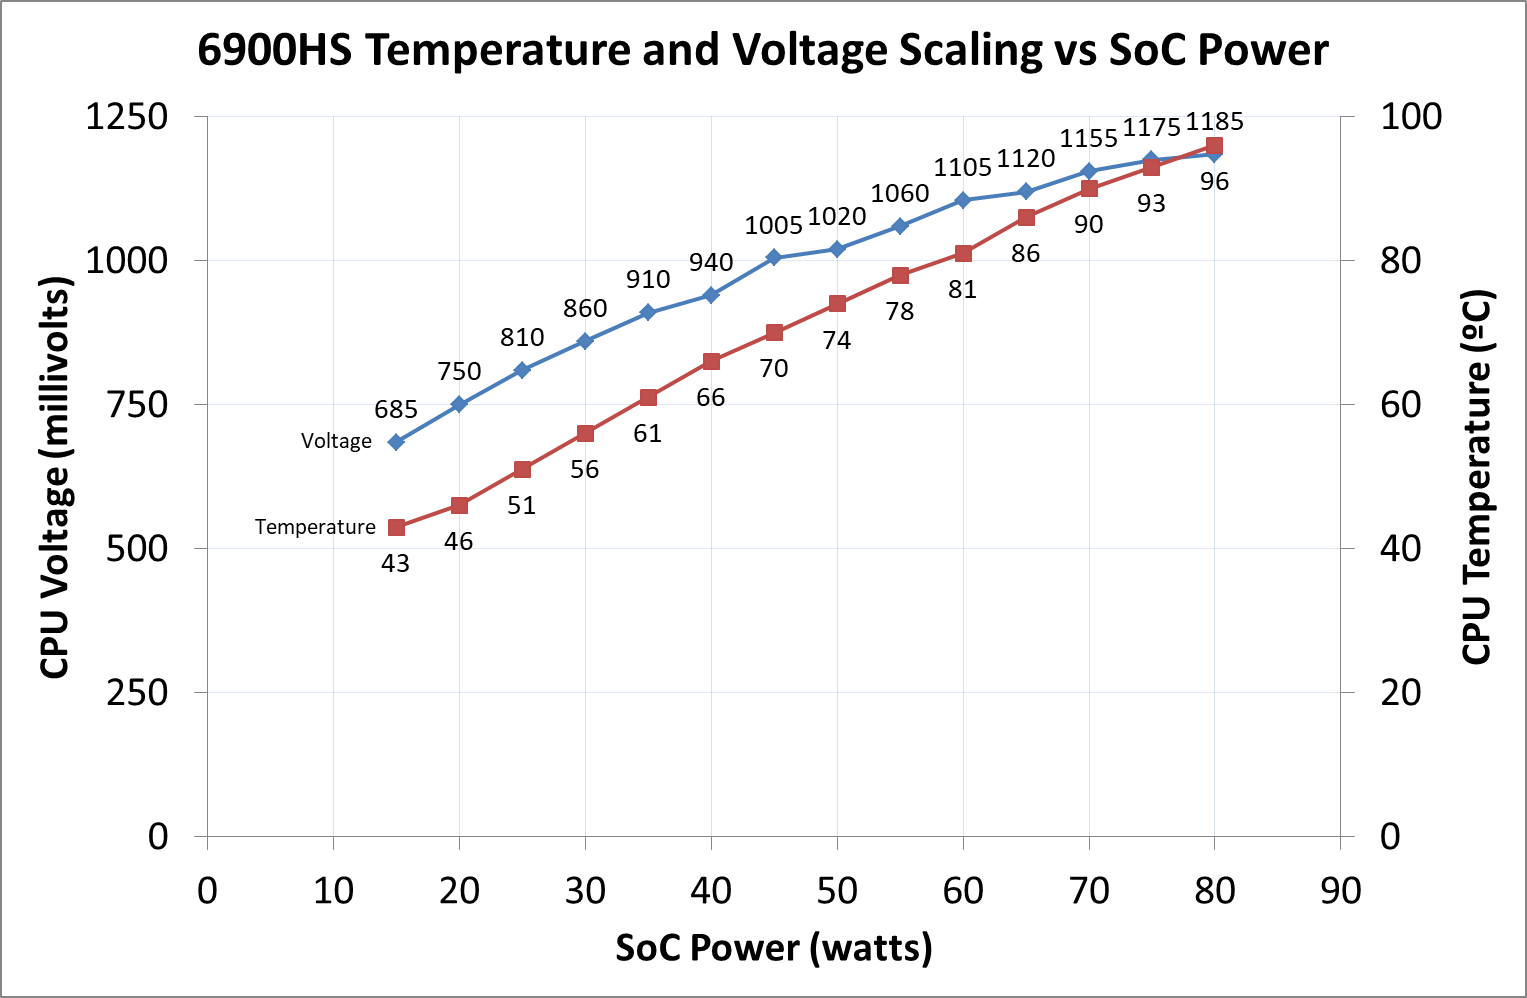
In this first graph, we monitor how the CPU voltage increases by raising the power, as well as the at-load temperature of the processor. The voltage increments start off around the 60-65 mW per 5W of SoC power, eventually becoming 15-25 W due to the way that voltage and power scales. The temperature was a very constant rise, showing 96ºC with the full 80 W selected.
Now if we transition this to the benchmark results, as we plot this with the all-core frequency as well:
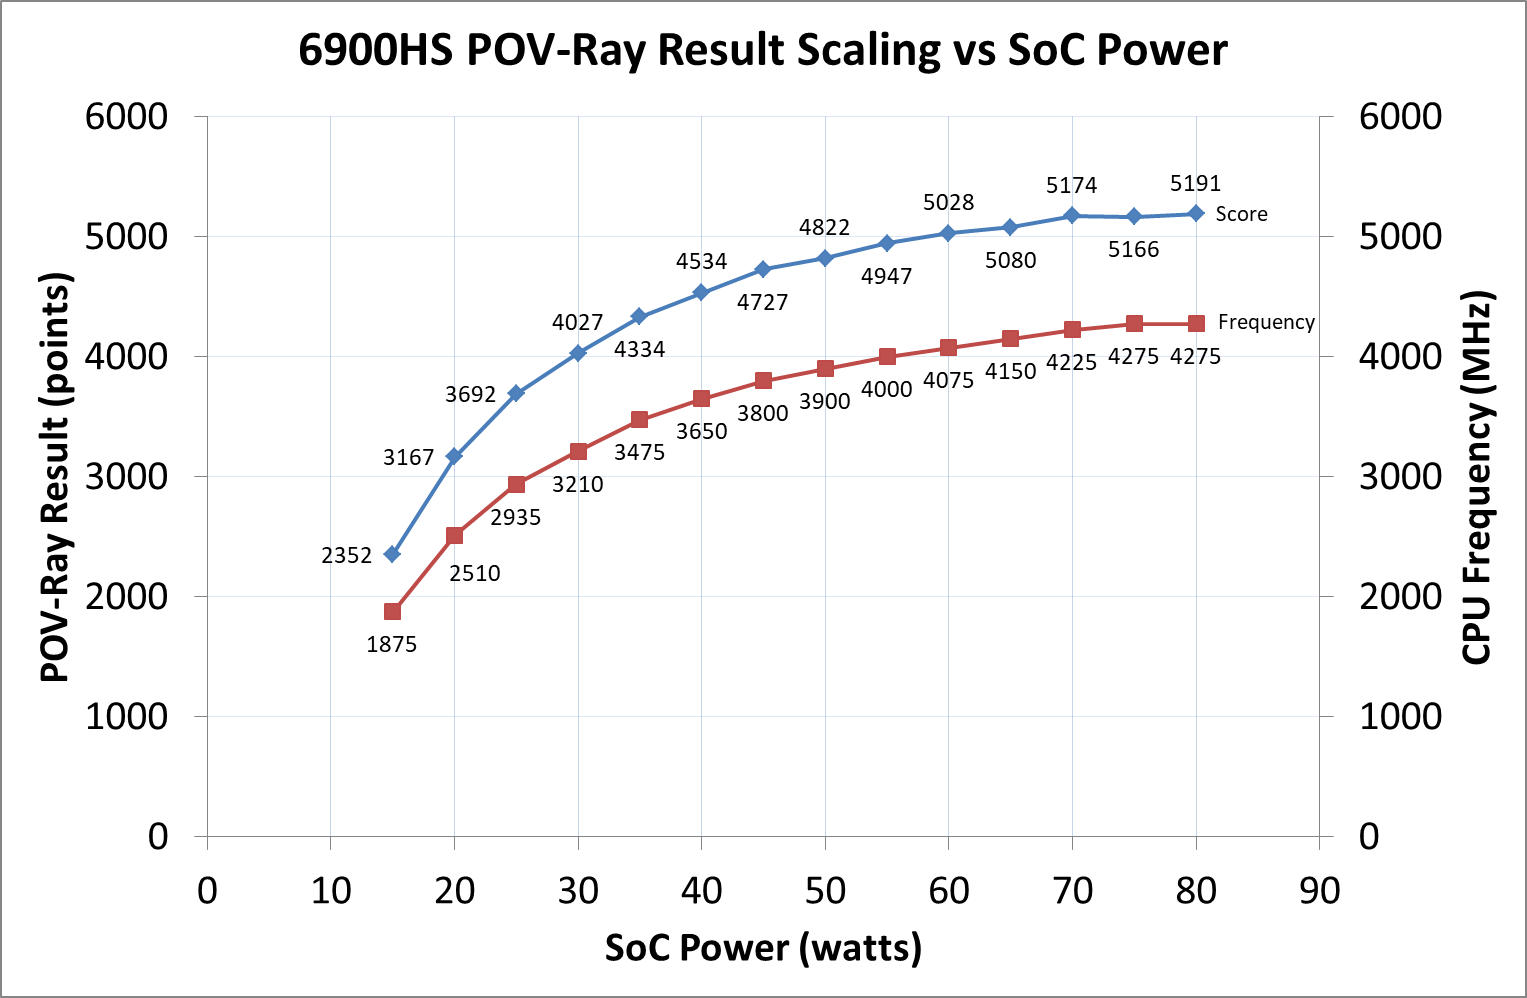
These two lines follow a similar pattern, as the score doesn't increase if the frequency doesn't increase. The biggest jumps are in the 15-35W mark, which is where most modern processors are the most efficient. However as the power is added in, the processor moves away from that ideal efficiency point, and going from 50 W to 80 W is a 60% power increase for only +375 MHz and only +7.7% increased score in the benchmark.
We can pivot this data into something a bit more familiar:
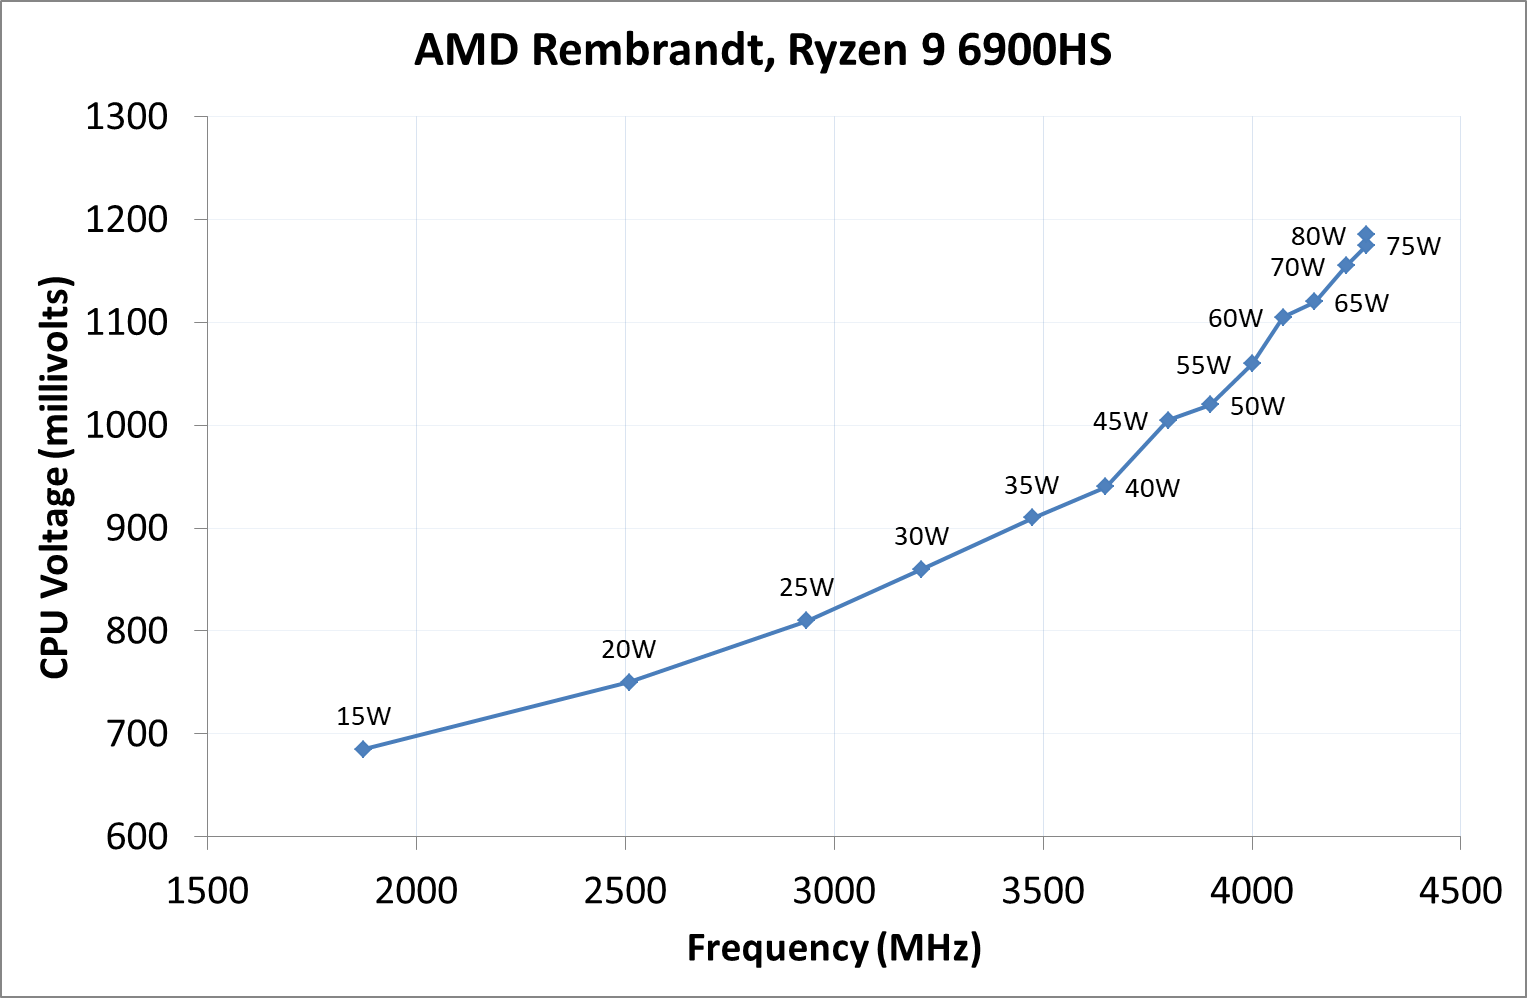
Here we can see the voltage required for all-core frequencies and how the voltage scales up. With all this data, we can actually do a performance per watt graph for Rembrandt:
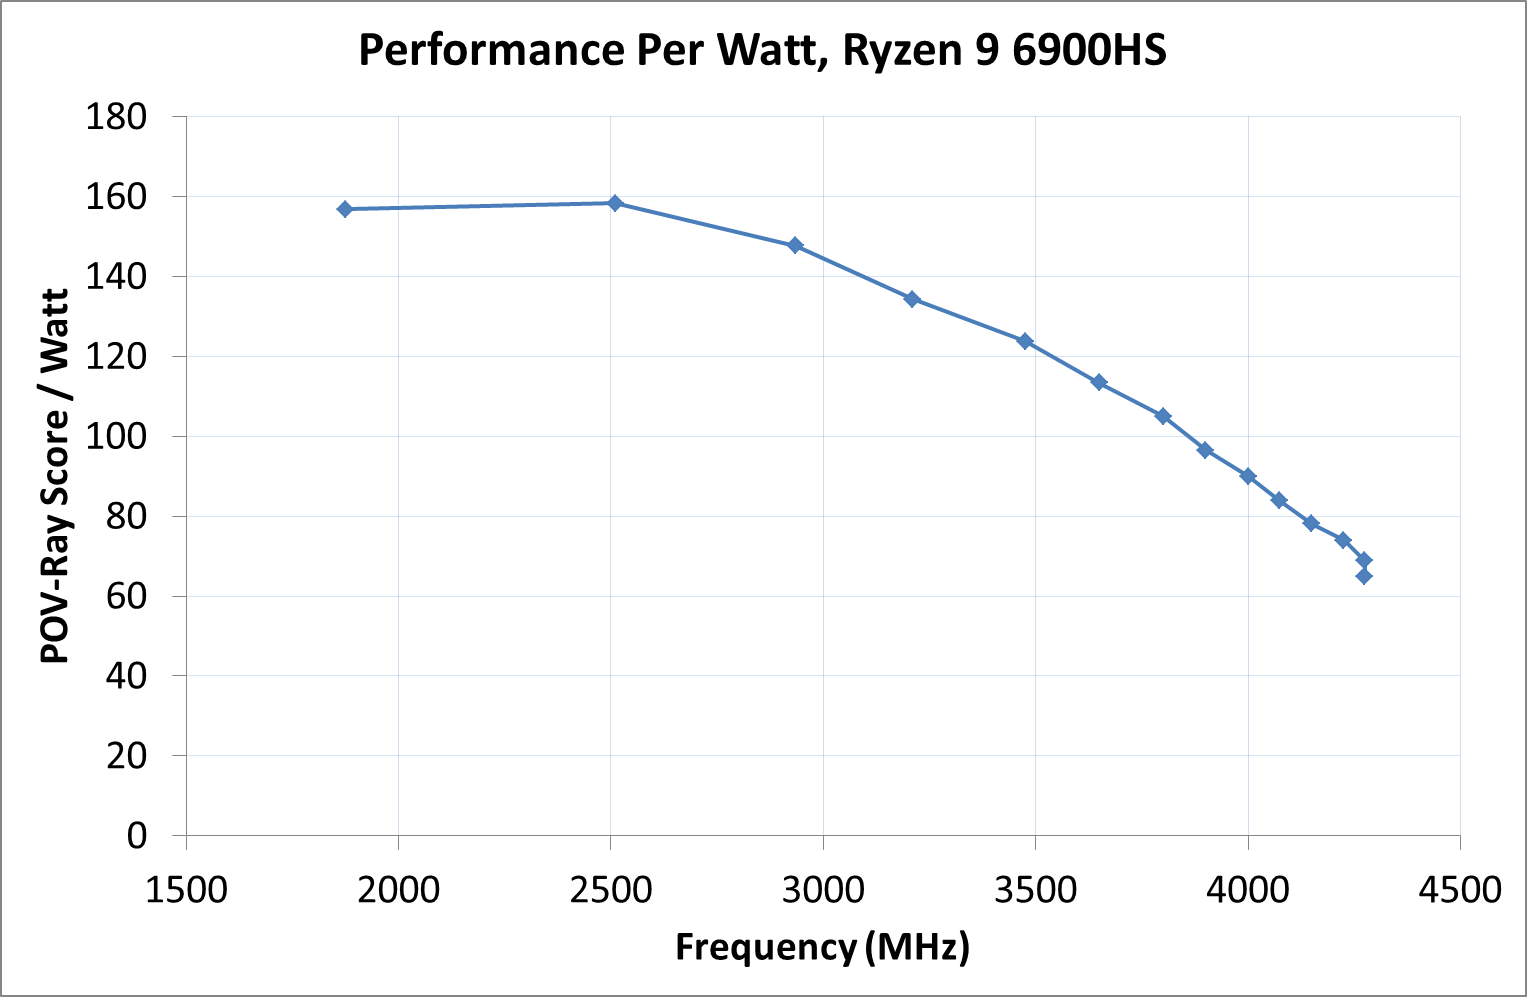
In this graph we're plotting Score per watt against Frequency, and it showcases that beyond 2.5 GHz, the Rembrandt CPU design becomes less efficient. Most modern processors end up being most efficient around this frequency, so it isn't perhaps all that surprising.
Now all of this is also subject to binning - not only are chips binned by the designation (6900HS vs 6800H for example), but also within an individual SKU, there will be better bins than others. We see this in some mobile processors that can have 10+ bins with different voltage/frequency characteristics, but all still called the same, because they perform at a shared guaranteed minimum. With smartphones, this testing is a lot easier, as that voltage/frequency table is often part of the hardware mechanism. But for notebooks and desktops, we're often at the mercy of the motherboard manufacturer or OEM, who can use their own settings, overriding anything that Intel or AMD suggest. Hopefully in the future we will get more control and be able to determine what is manufacturer based and what is motherboard based.


92 Comments
View All Comments
mode_13h - Tuesday, March 1, 2022 - link
> 3D Particle Movement v2.1> ...
> To keep things honest, AMD also has a copy of the code, but has not proposed any changes.
No, to keep things honest, you need to release the benchmark. All of your other benchmarks are publicly-available, but not this one.
Please open source it, or stop using it. Thanks.
isthisavailable - Wednesday, March 2, 2022 - link
So there are no battery life and iGPU results in a mobile processor review...right.mode_13h - Wednesday, March 2, 2022 - link
IMO, the article was long enough and had plenty to cover. I think it's not a problem, if those are reviewed separately, however it does make the overall comparison vs. Intel problematic.Anyway, we now know Ian was writing it on his way out the door, so that makes it at least understandable.
Stuka87 - Wednesday, March 2, 2022 - link
I am awaiting the day where Ryzens become more widespread in workstation class laptops. Very few machines had them when I had to upgrade this past summer, so had to go Intel. Which has been a bit lack luster.PlanetLockdownFilm - Wednesday, March 2, 2022 - link
Interesting read, buts seems like it depends on what offer you can find and what else the laptop has to give. RDNA2 is a plus though, if you're going for integrated graphics.WaltC - Wednesday, March 2, 2022 - link
I thought it was fairly interesting that although I looked for it, I could not find a description of the system used to supply the Intel numbers that were plugged into the charts used--if those specs are included and I missed them, then mea culpa. But if not, well, that's interesting...and I also found it very interesting that Intel was nowhere to be found/mentioned in the Performance Per Watt section...;)mode_13h - Thursday, March 3, 2022 - link
> I also found it very interesting that Intel was nowhere to be found/mentioned> in the Performance Per Watt section...;)
Exactly. What they did show was that Intel could/would scale up power consumption of its single-core performance higher than Zen 3+. What's not obvious is how much of Intel's performance advantage simply comes down to juicing their P-cores, at the expense of efficiency.
Dug - Friday, March 11, 2022 - link
I want to see how well each system does when not plugged in.m16 - Thursday, March 3, 2022 - link
Wow, I know what I'll be recommending for non desktop replacements.This specific laptop also perhaps helps a bit, that's how I'd expect other manufacturers to build their workhorses for decent cooling.
beginner99 - Friday, March 4, 2022 - link
Now AT isn't doing GPU tests on an APU. I mean really?