AMD's Ryzen 9 6900HS Rembrandt Benchmarked: Zen3+ Power and Performance Scaling
by Dr. Ian Cutress on March 1, 2022 9:30 AM ESTPerformance Per Watt
With the ASUS Zephyrus G14, it comes with some fancy ASUS software called the Armo(u)ry Crate. Inside is the usual array of options for a modern laptop when it comes to performance profiles, fans, special RGB effects and lighting, information about voltages, frequencies, fan speeds, fan profiles, and all that jazz. However inside the software there is also an interface that allows the user to cap how much APU/SoC power can be put through the processor or the whole platform.
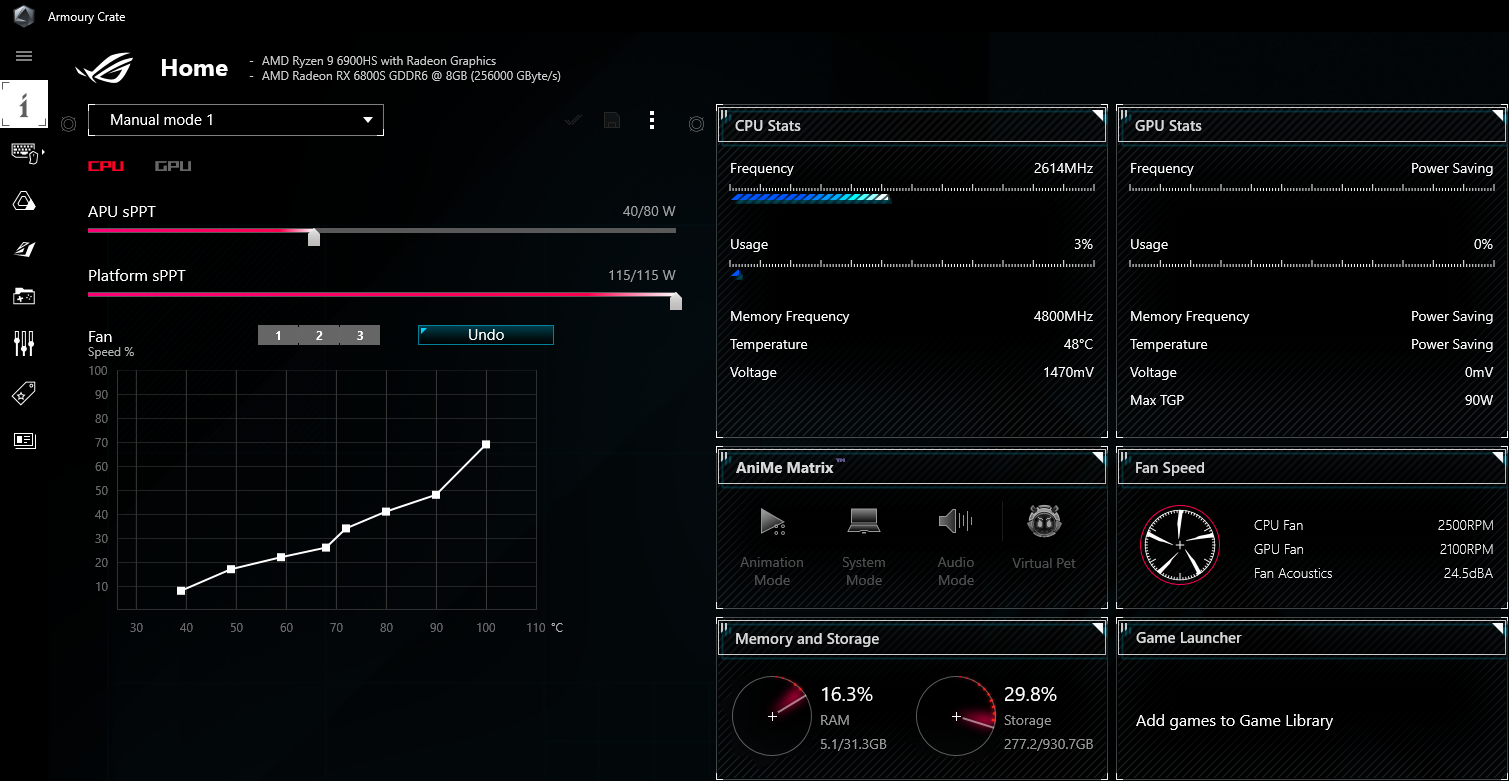
With this option, we took advantage of the fact that the after we select a given SoC wattage, the system will automatically migrate to the required voltage and frequency under load while only ever going up to the power limits - or as much as the system would be allowed to. Using this tool, we ran a spectrum of performance data against power options to see how the POV-Ray benchmark would scale, as it is one of the benchmarks that drives core use very high and very hard.
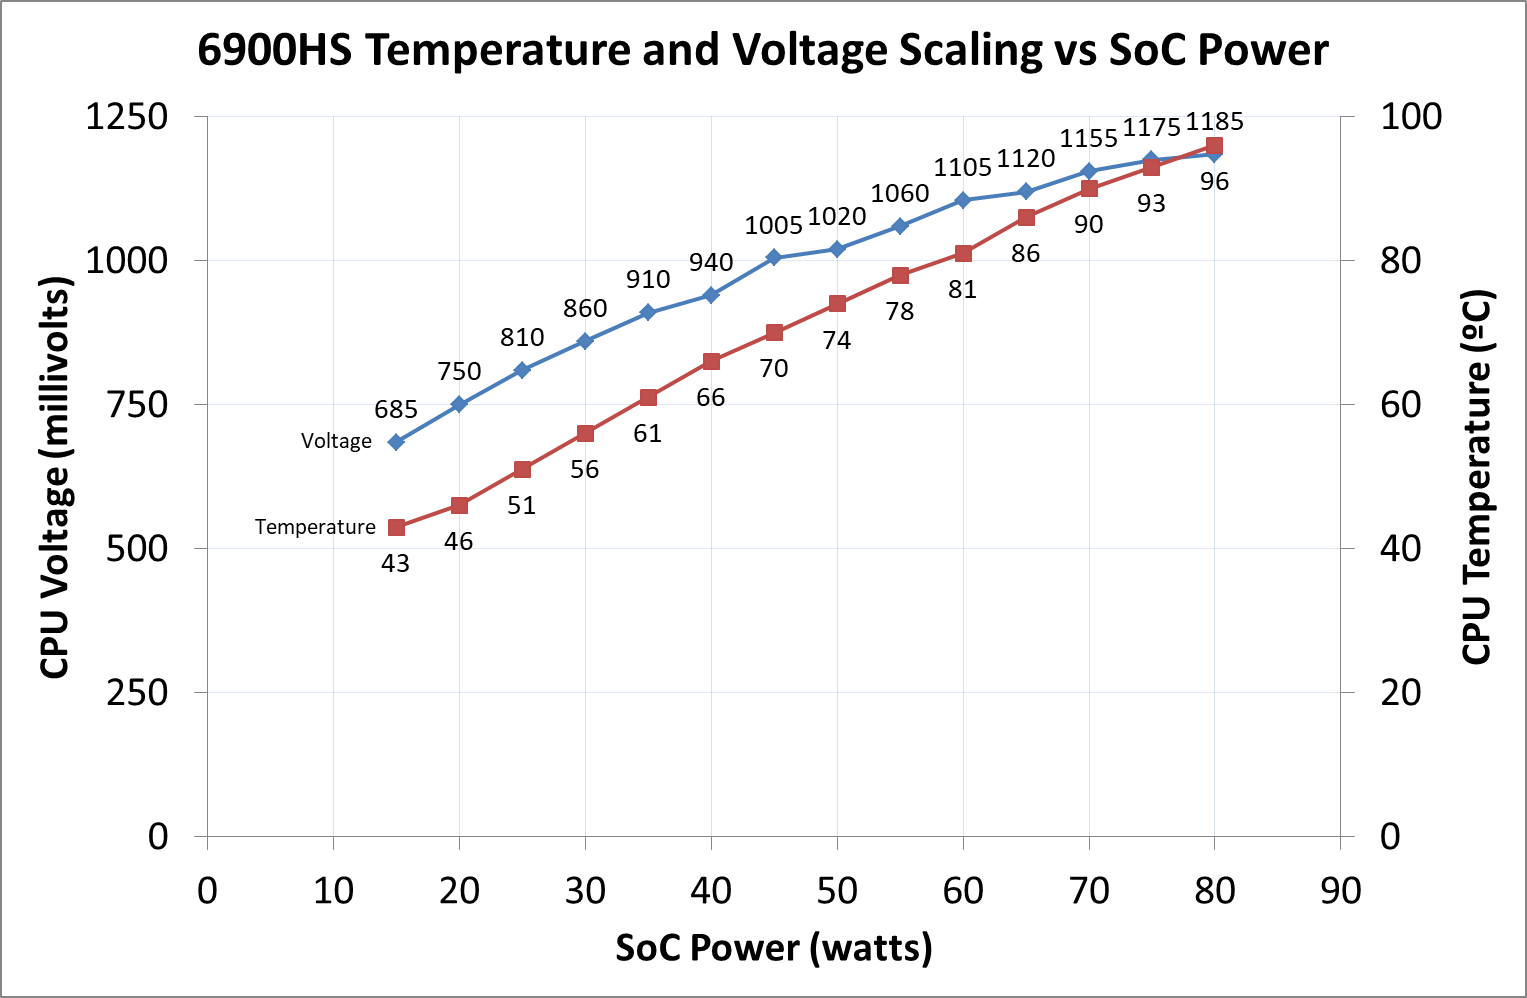
In this first graph, we monitor how the CPU voltage increases by raising the power, as well as the at-load temperature of the processor. The voltage increments start off around the 60-65 mW per 5W of SoC power, eventually becoming 15-25 W due to the way that voltage and power scales. The temperature was a very constant rise, showing 96ºC with the full 80 W selected.
Now if we transition this to the benchmark results, as we plot this with the all-core frequency as well:
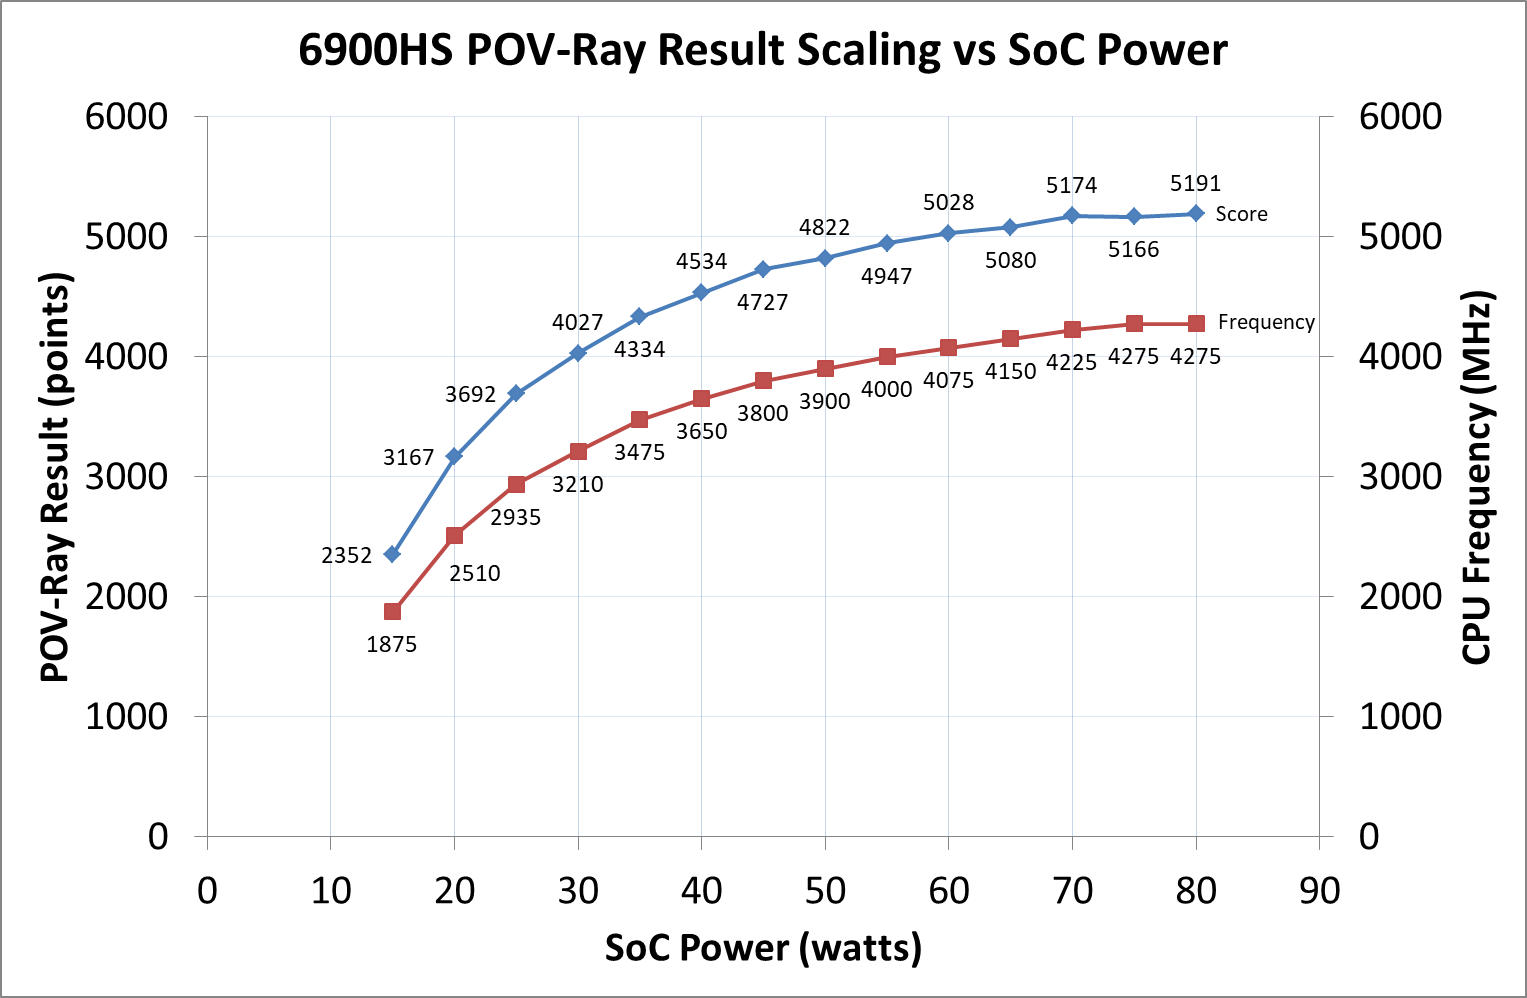
These two lines follow a similar pattern, as the score doesn't increase if the frequency doesn't increase. The biggest jumps are in the 15-35W mark, which is where most modern processors are the most efficient. However as the power is added in, the processor moves away from that ideal efficiency point, and going from 50 W to 80 W is a 60% power increase for only +375 MHz and only +7.7% increased score in the benchmark.
We can pivot this data into something a bit more familiar:
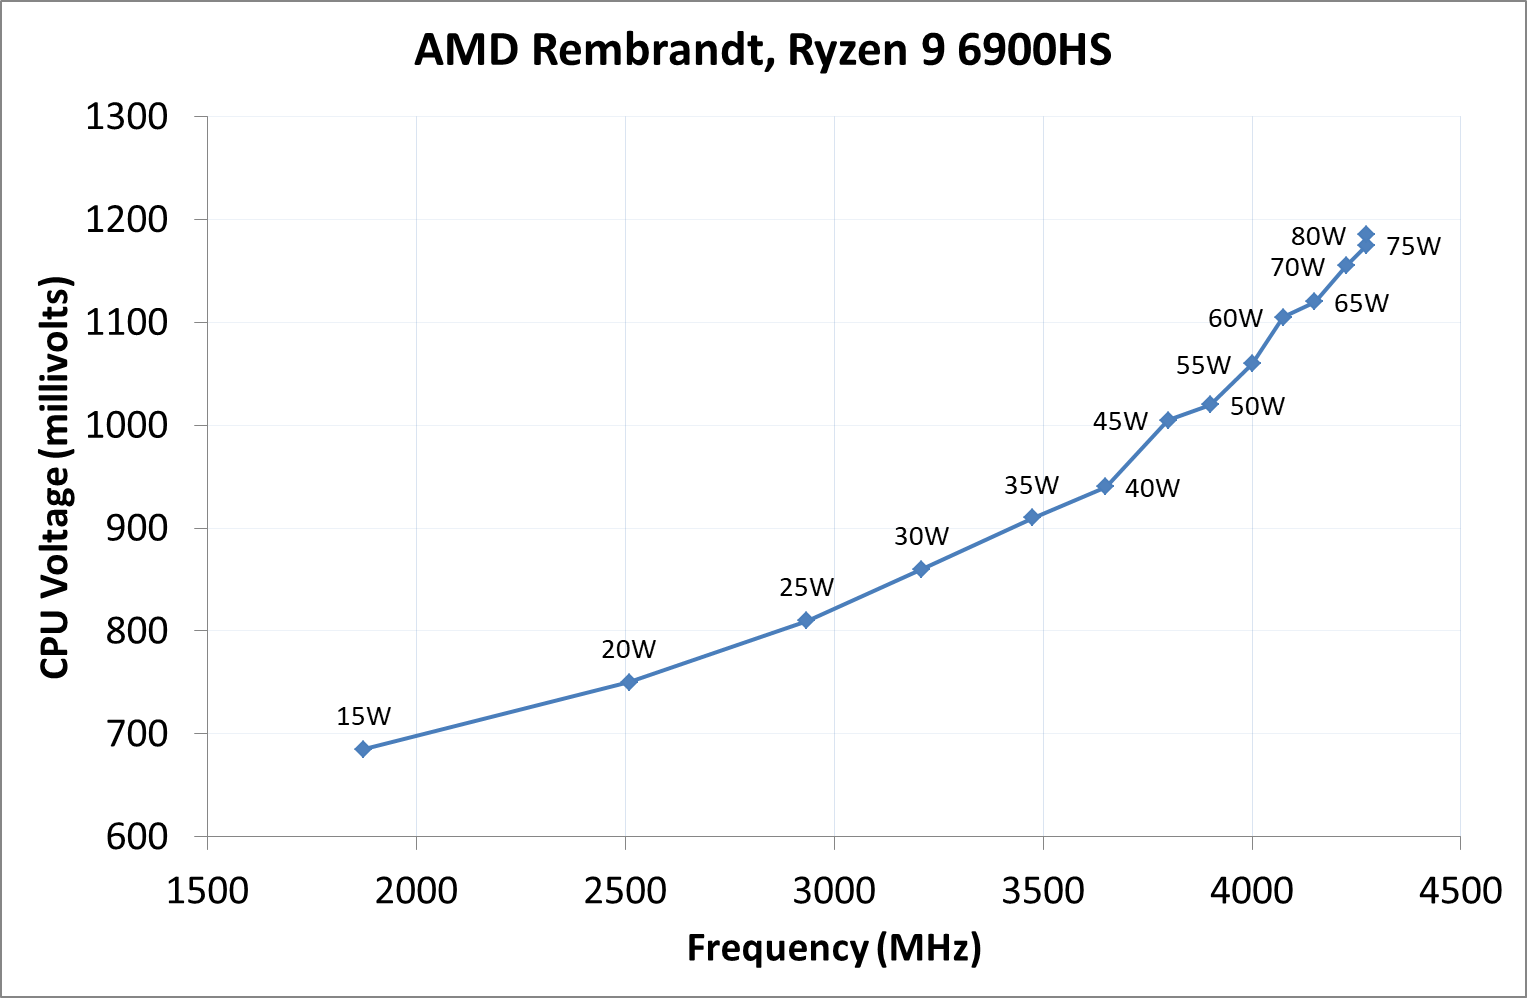
Here we can see the voltage required for all-core frequencies and how the voltage scales up. With all this data, we can actually do a performance per watt graph for Rembrandt:
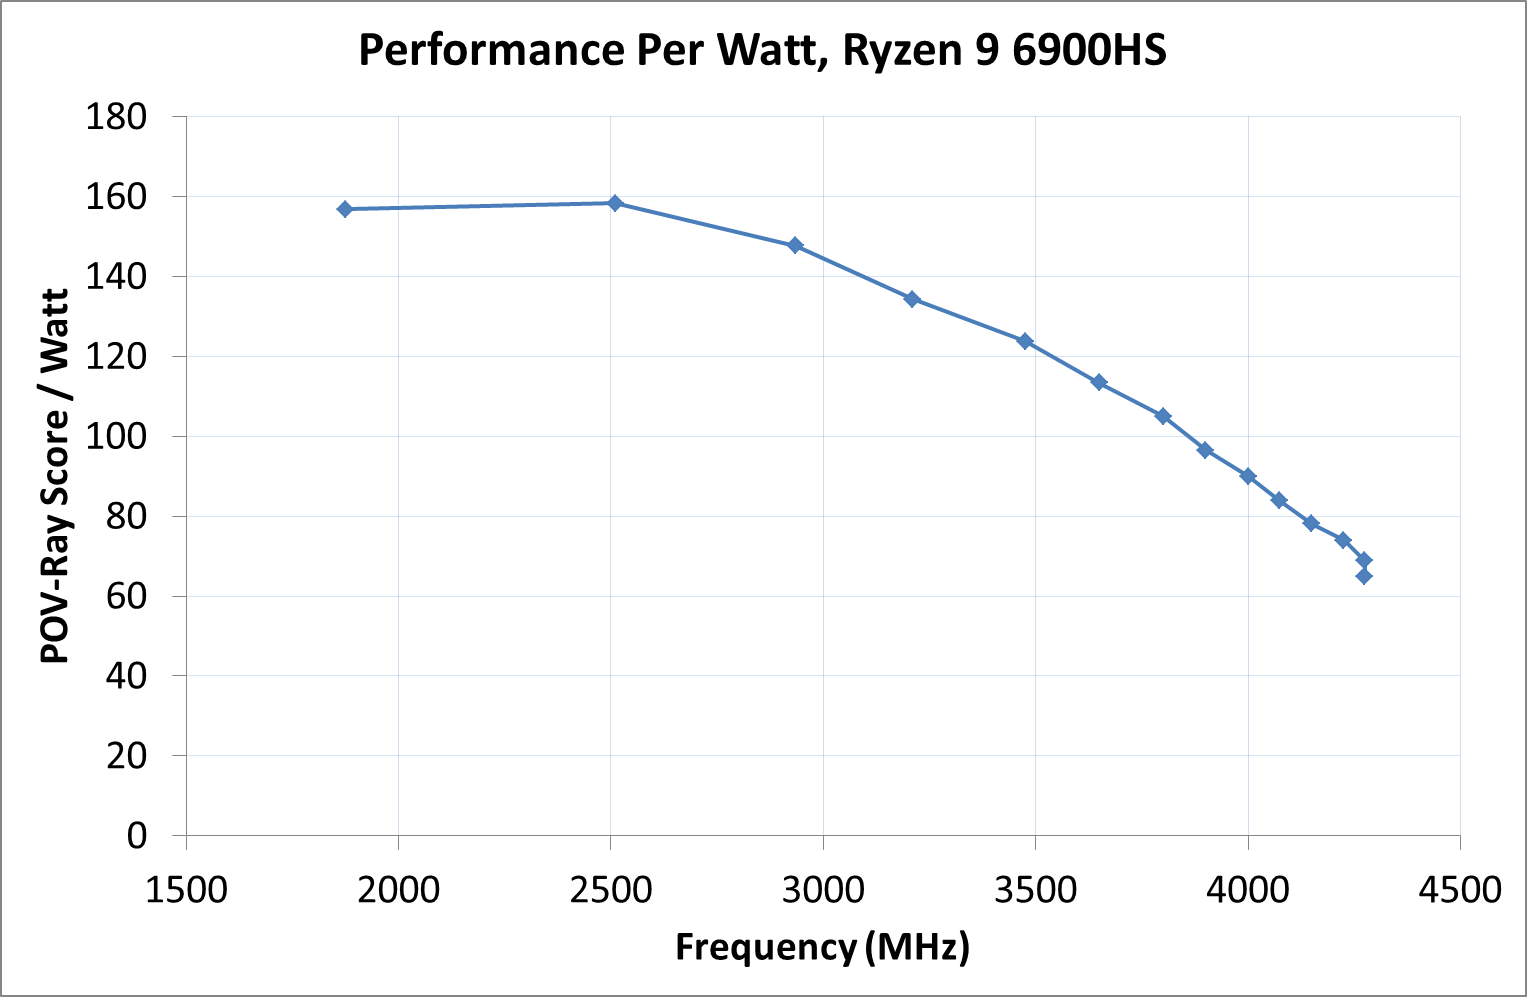
In this graph we're plotting Score per watt against Frequency, and it showcases that beyond 2.5 GHz, the Rembrandt CPU design becomes less efficient. Most modern processors end up being most efficient around this frequency, so it isn't perhaps all that surprising.
Now all of this is also subject to binning - not only are chips binned by the designation (6900HS vs 6800H for example), but also within an individual SKU, there will be better bins than others. We see this in some mobile processors that can have 10+ bins with different voltage/frequency characteristics, but all still called the same, because they perform at a shared guaranteed minimum. With smartphones, this testing is a lot easier, as that voltage/frequency table is often part of the hardware mechanism. But for notebooks and desktops, we're often at the mercy of the motherboard manufacturer or OEM, who can use their own settings, overriding anything that Intel or AMD suggest. Hopefully in the future we will get more control and be able to determine what is manufacturer based and what is motherboard based.


92 Comments
View All Comments
tygrus - Tuesday, March 8, 2022 - link
I started typing a comment using Chrome browser on iPad (just like this). The page or adverts triggered a page refresh. Looses comment, gone… empty. Very annoying.mode_13h - Wednesday, March 9, 2022 - link
FWIW, I use Firefox on PC and never had such a problem.