Intel Core i7-10700 vs Core i7-10700K Review: Is 65W Comet Lake an Option?
by Dr. Ian Cutress on January 21, 2021 10:30 AM EST- Posted in
- CPUs
- Intel
- Core i7
- Z490
- 10th Gen Core
- Comet Lake
- i7-10700K
- i7-10700
CPU Tests: Simulation
Simulation and Science have a lot of overlap in the benchmarking world, however for this distinction we’re separating into two segments mostly based on the utility of the resulting data. The benchmarks that fall under Science have a distinct use for the data they output – in our Simulation section, these act more like synthetics but at some level are still trying to simulate a given environment.
DigiCortex v1.35: link
DigiCortex is a pet project for the visualization of neuron and synapse activity in the brain. The software comes with a variety of benchmark modes, and we take the small benchmark which runs a 32k neuron/1.8B synapse simulation, similar to a small slug.
The results on the output are given as a fraction of whether the system can simulate in real-time, so anything above a value of one is suitable for real-time work. The benchmark offers a 'no firing synapse' mode, which in essence detects DRAM and bus speed, however we take the firing mode which adds CPU work with every firing.

The software originally shipped with a benchmark that recorded the first few cycles and output a result. So while fast multi-threaded processors this made the benchmark last less than a few seconds, slow dual-core processors could be running for almost an hour. There is also the issue of DigiCortex starting with a base neuron/synapse map in ‘off mode’, giving a high result in the first few cycles as none of the nodes are currently active. We found that the performance settles down into a steady state after a while (when the model is actively in use), so we asked the author to allow for a ‘warm-up’ phase and for the benchmark to be the average over a second sample time.
For our test, we give the benchmark 20000 cycles to warm up and then take the data over the next 10000 cycles seconds for the test – on a modern processor this takes 30 seconds and 150 seconds respectively. This is then repeated a minimum of 10 times, with the first three results rejected. Results are shown as a multiple of real-time calculation.
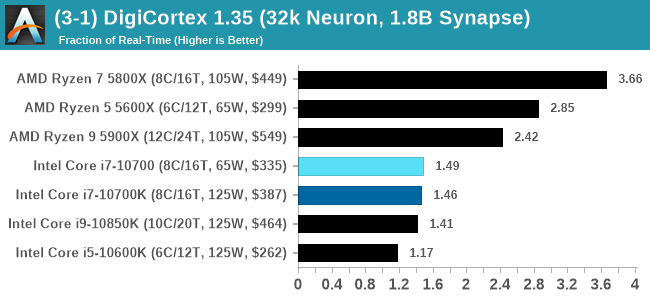
For users wondering why the 5800X wins, it seems that Digicortex prefers single chiplet designs, and the more cores the better. On the Intel side, the 10700 pulls a slight lead.
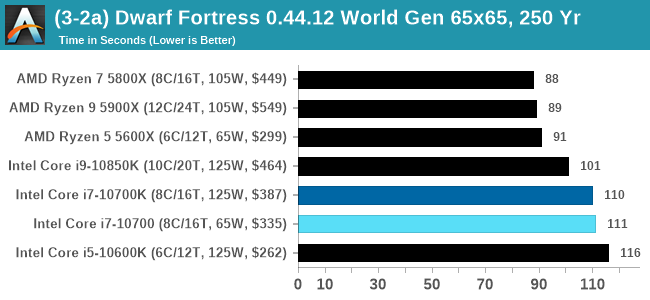
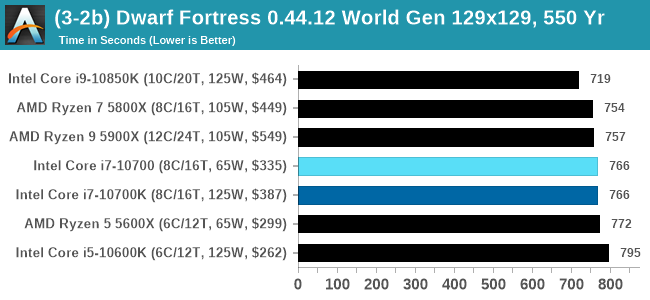
Dwarf Fortress 0.44.12: Link
Another long standing request for our benchmark suite has been Dwarf Fortress, a popular management/roguelike indie video game, first launched in 2006 and still being regularly updated today, aiming for a Steam launch sometime in the future.
Emulating the ASCII interfaces of old, this title is a rather complex beast, which can generate environments subject to millennia of rule, famous faces, peasants, and key historical figures and events. The further you get into the game, depending on the size of the world, the slower it becomes as it has to simulate more famous people, more world events, and the natural way that humanoid creatures take over an environment. Like some kind of virus.
For our test we’re using DFMark. DFMark is a benchmark built by vorsgren on the Bay12Forums that gives two different modes built on DFHack: world generation and embark. These tests can be configured, but range anywhere from 3 minutes to several hours. After analyzing the test, we ended up going for three different world generation sizes:
- Small, a 65x65 world with 250 years, 10 civilizations and 4 megabeasts
- Medium, a 127x127 world with 550 years, 10 civilizations and 4 megabeasts
- Large, a 257x257 world with 550 years, 40 civilizations and 10 megabeasts
DFMark outputs the time to run any given test, so this is what we use for the output. We loop the small test for as many times possible in 10 minutes, the medium test for as many times in 30 minutes, and the large test for as many times in an hour.

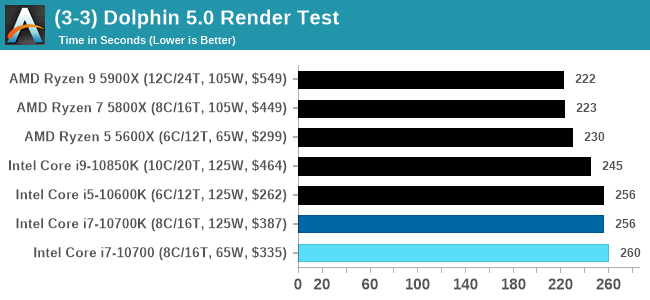
Dolphin v5.0 Emulation: Link
Many emulators are often bound by single thread CPU performance, and general reports tended to suggest that Haswell provided a significant boost to emulator performance. This benchmark runs a Wii program that ray traces a complex 3D scene inside the Dolphin Wii emulator. Performance on this benchmark is a good proxy of the speed of Dolphin CPU emulation, which is an intensive single core task using most aspects of a CPU. Results are given in seconds, where the Wii itself scores 1051 seconds.


210 Comments
View All Comments
alexane - Sunday, January 24, 2021 - link
easy job online from home. I have received exactly $20845 last month from this home job. Join now this job and start making extra cash online. salary8 . comMilaEaston - Tuesday, January 26, 2021 - link
easy job online from home. I have received exactly $20845 last month from this home job. Join now this job and start making extra cash online. salary8 . com
flyingpants265 - Friday, January 22, 2021 - link
Right. I'm not even sure why this is an issue. TDP stands for "thermal design power", it's how much power the chip uses, it's not debatable.etal2 - Thursday, January 21, 2021 - link
What I'm missing from this review is a benchmark running under intels recommended settings.From what I've seen often people see the 65w rating and go on to combine the i7-10700 with cheap B460/H470 motherboards and basic coolers.
Duraz0rz - Thursday, January 21, 2021 - link
The problem here is that the turbo limit is not enforced by the chip, but by the mobo. So even cheap B460/H470 boards can set that limit to be higher than Intel's recommendations if they choose to. And no one that would be buying these boards will necessarily care to dig into the BIOS and set the limits themselves.Cygni - Thursday, January 21, 2021 - link
Yes, they would. There are lots of (admittedly niche) applications where outright sustained performance is less important that bursty performance in a limited thermal envelope, either due to space or ventilations issues. HTPCs, home servers, small industry applications, etcSo yeah, i agree with the OP, I would have liked to have seen performance numbers at the "suggested" 65w PL1.
Calin - Friday, January 22, 2021 - link
I totally agree with your comment, but what you ask for is a different article.Performance numbers in a strictly power limited environment - from Intel and AMD both (although Intel will be unfairly penalized by being three or so lithography generations behind).
Spunjji - Friday, January 22, 2021 - link
"unfairly penalized"The product you test is the product they have on sale - that's not unfair in the context of a test designed to represent a specific real-world requirement.
olde94 - Monday, January 25, 2021 - link
yeah i never heard anyone saing that amd was "unfairly penalized" in 2015. they could just "suck it up"Spunjji - Monday, January 25, 2021 - link
To be fair, some people did (GloFo's 28nm is terrible, I don't care about power, etc.) and I had no time for them either.