Intel NUC10i7FNH Frost Canyon Review: Hexa-Core NUC Delivers a Mixed Bag
by Ganesh T S on March 2, 2020 9:00 AM ESTMiscellaneous Performance Metrics
This section looks at some of the other commonly used benchmarks representative of the performance of specific real-world applications.
3D Rendering - CINEBENCH R15
We use CINEBENCH R15 for 3D rendering evaluation. The program provides three benchmark modes - OpenGL, single threaded and multi-threaded. Evaluation of different PC configurations in all three modes provided us the following results. It must be noted that R15 is good enough for the current crop of SFF PCs. Once we start getting 16 cores or more, the shift to more modern versions of CINEBENCH will be made.
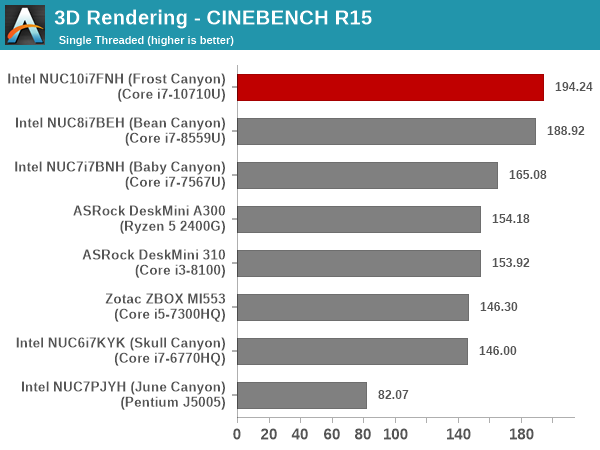
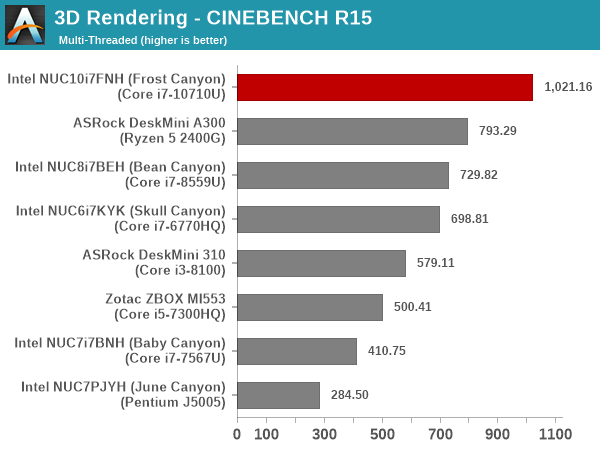
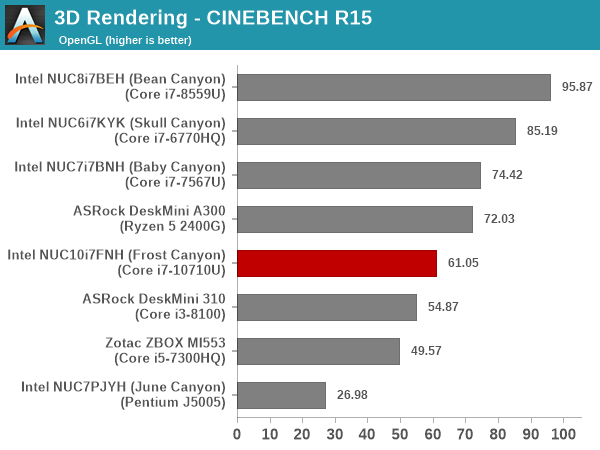
Except for the OpenGL case, both the single (ST) and multi-threaded (MT) versions bring out Frost Canyon on top. As expected, there is negligible difference in the ST performance of the Bean Canyon and Frost Canyon NUCs, as the CPUs are both based on the same Skylake microarchitecture, with the optimizations allowing for higher clocks getting compensated by the increased core count in the processor.
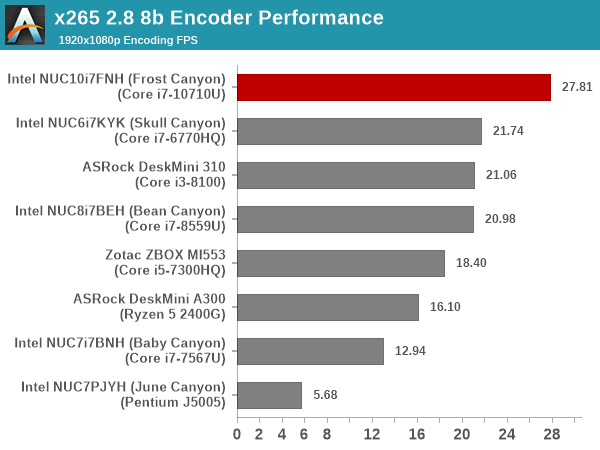
x265 Benchmark
Next up, we have some video encoding benchmarks using x265 v2.8. The appropriate encoder executable is chosen based on the supported CPU features. In the first case, we encode 600 1080p YUV 4:2:0 frames into a 1080p30 HEVC Main-profile compatible video stream at 1 Mbps and record the average number of frames encoded per second.
Our second test case is 1200 4K YUV 4:2:0 frames getting encoded into a 4Kp60 HEVC Main10-profile video stream at 35 Mbps. The encoding FPS is recorded.
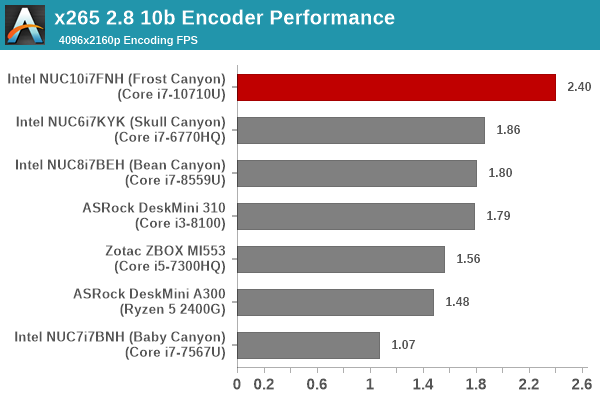
In both cases, the hexa-core nature of Frost Canyon stands in good stead, even enabling it to get a sizable lead over competing systems sporting processors with higher TDPs.
7-Zip
7-Zip is a very effective and efficient compression program, often beating out OpenCL accelerated commercial programs in benchmarks even while using just the CPU power. 7-Zip has a benchmarking program that provides tons of details regarding the underlying CPU's efficiency. In this subsection, we are interested in the compression and decompression rates when utilizing all the available threads for the LZMA algorithm.
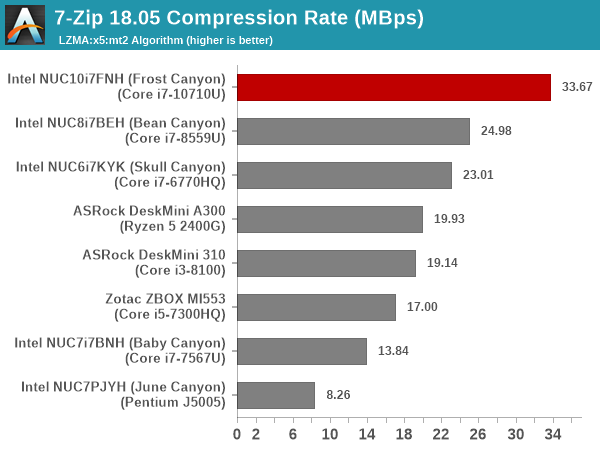
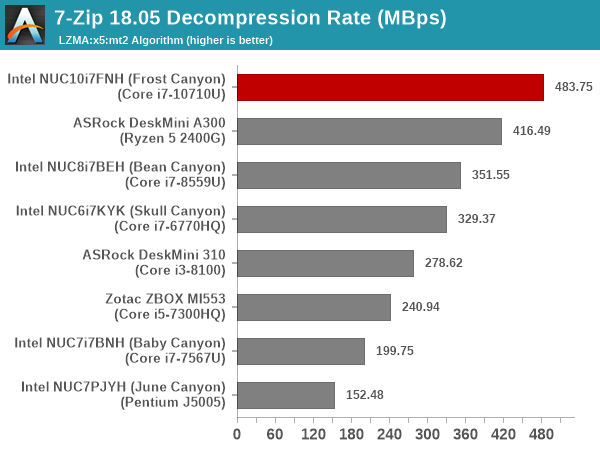
Here, we again see the hexa-core feature enabling Frost Canyon to surpass the performance of systems sporting processors with higher TDPs.
Cryptography Benchmarks
Cryptography has become an indispensable part of our interaction with computing systems. Almost all modern systems have some sort of hardware-acceleration for making cryptographic operations faster and more power efficient. In this sub-section, we look at two different real-world applications that may make use of this acceleration.
BitLocker is a Windows features that encrypts entire disk volumes. While drives that offer encryption capabilities are dealt with using that feature, most legacy systems and external drives have to use the host system implementation. Windows has no direct benchmark for BitLocker. However, we cooked up a BitLocker operation sequence to determine the adeptness of the system at handling BitLocker operations. We start off with a 2.5GB RAM drive in which a 2GB VHD (virtual hard disk) is created. This VHD is then mounted, and BitLocker is enabled on the volume. Once the BitLocker encryption process gets done, BitLocker is disabled. This triggers a decryption process. The times taken to complete the encryption and decryption are recorded. This process is repeated 25 times, and the average of the last 20 iterations is graphed below.
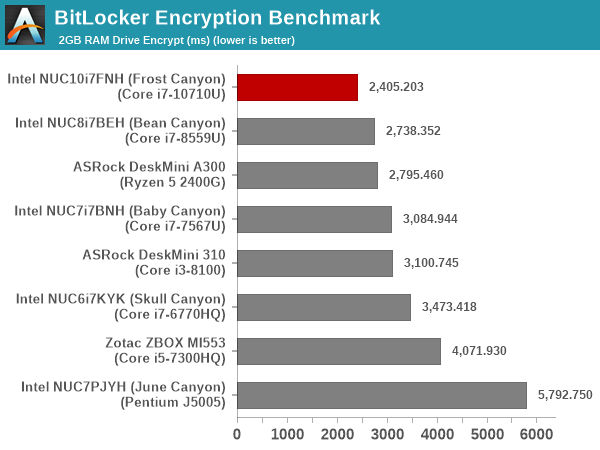
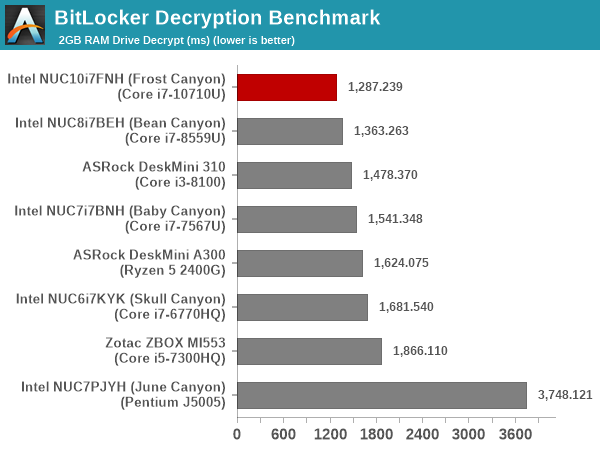
The availability of 6 cores to issue AES-NI operations on enables BitLocker to perform better on the Frost Canyon compared to Bean Canyon, despite the Bean Canyon configuration sporting a much higher performing memory sub-system with a DDR4-3000 SODIMM kit at a lower latency.
Creation of secure archives is best done through the use of AES-256 as the encryption method while password protecting ZIP files. We re-use the benchmark mode of 7-Zip to determine the AES256-CBC encryption and decryption rates using pure software as well as AES-NI. Note that the 7-Zip benchmark uses a 48KB buffer for this purpose.
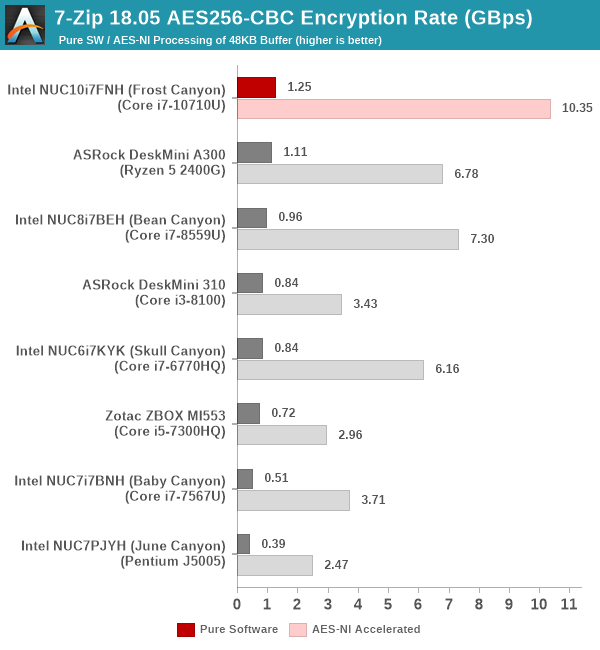
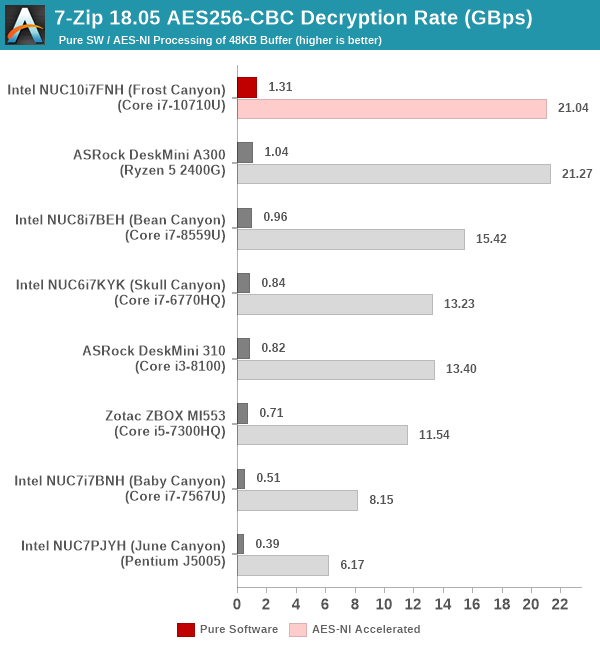
The observations we made for the BitLocker workload work for 7-Zip too. The Ryzen 5 2400G, for some reason, seems to offer much faster / optimized hardware acceleration for certain cryptographic operations, enabling it to be neck-and-neck with the Frost Canyon for AES256-CBC decryption in the above case. Obviously, the TDP difference (65W vs 25W) needs to be taken into account, though it is likely that the Frost Canyon NUC was at turbo-speeds in PL2 for at least the first few iterations of the benchmark.
Yet another cryptography application is secure network communication. OpenSSL can take advantage of the acceleration provided by the host system to make operations faster. It also has a benchmark mode that can use varying buffer sizes. We recorded the processing rate for a 8KB buffer using the hardware-accelerated AES256-CBC-HAC-SHA1 feature.
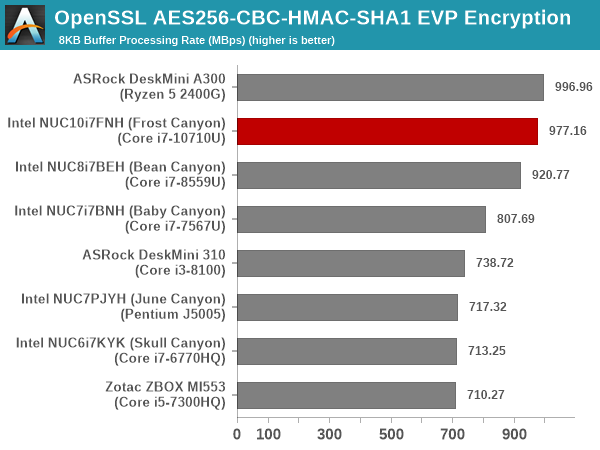
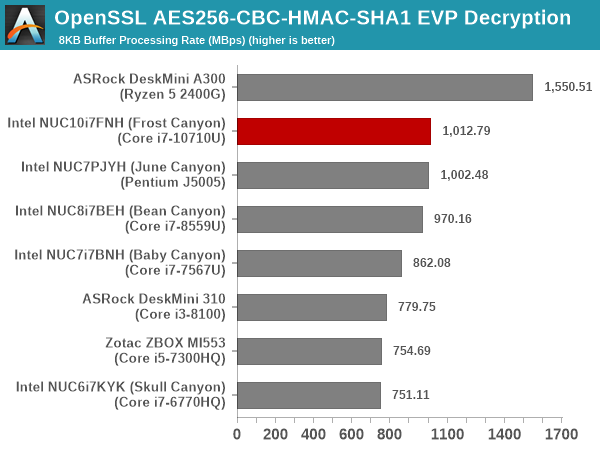
Here, we see the Ryzen 5 2400G completely outperform the Frost Canyon NUC due to better optimization of the workload for the hardware acceleration capabilities offered by the Ryzen processor.
Agisoft Photoscan
Agisoft PhotoScan is a commercial program that converts 2D images into 3D point maps, meshes and textures. The program designers sent us a command line version in order to evaluate the efficiency of various systems that go under our review scanner. The command line version has two benchmark modes, one using the CPU and the other using both the CPU and GPU (via OpenCL). We present the results from our evaluation using the CPU mode only. The benchmark (v1.3) takes 84 photographs and does four stages of computation:
- Stage 1: Align Photographs (capable of OpenCL acceleration)
- Stage 2: Build Point Cloud (capable of OpenCL acceleration)
- Stage 3: Build Mesh
- Stage 4: Build Textures
We record the time taken for each stage. Since various elements of the software are single threaded, and others multithreaded, it is interesting to record the effects of CPU generations, speeds, number of cores, and DRAM parameters using this software.
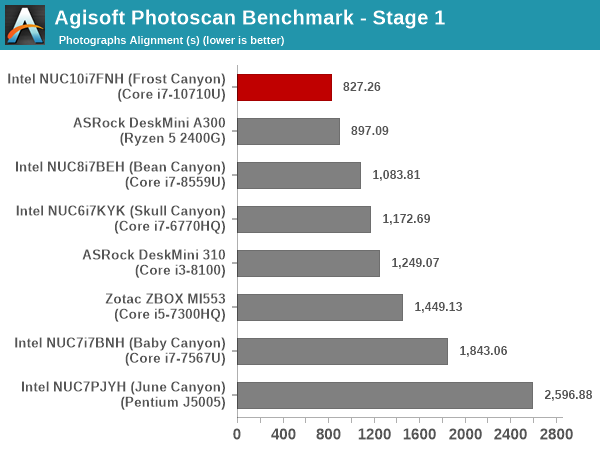
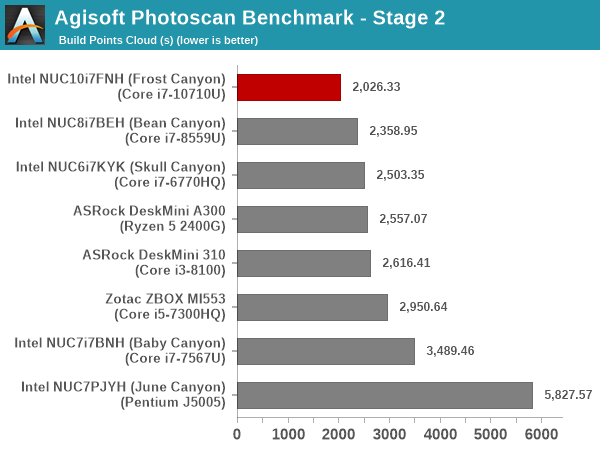
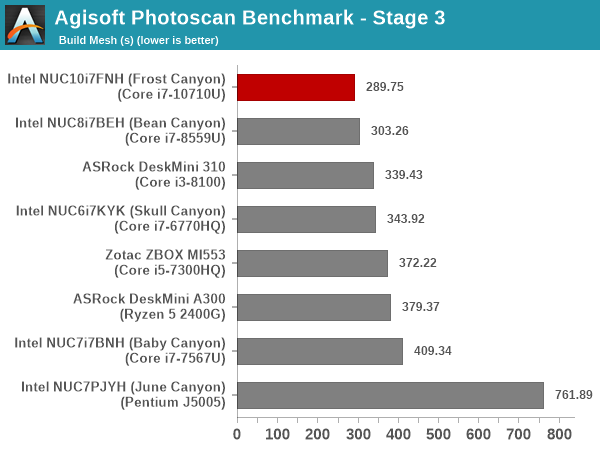
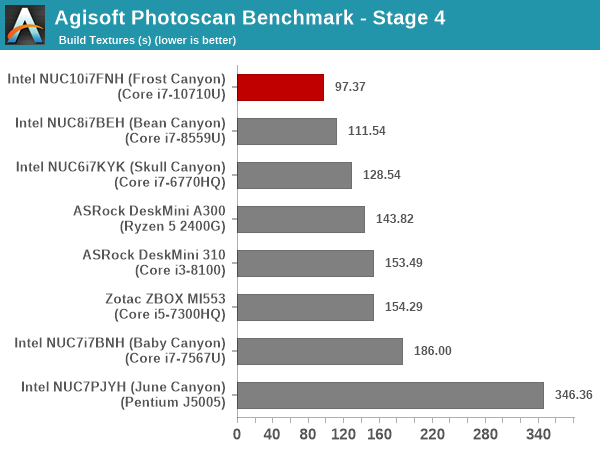
The hexa-core nature makes the Frost Canyon NUC emerge as the best performer in the Agisoft Photoscan benchmark across all the SFF PCs considered in this review.
Dolphin Emulator
Wrapping up our application benchmark numbers is the new Dolphin Emulator (v5) benchmark mode results. This is again a test of the CPU capabilities.
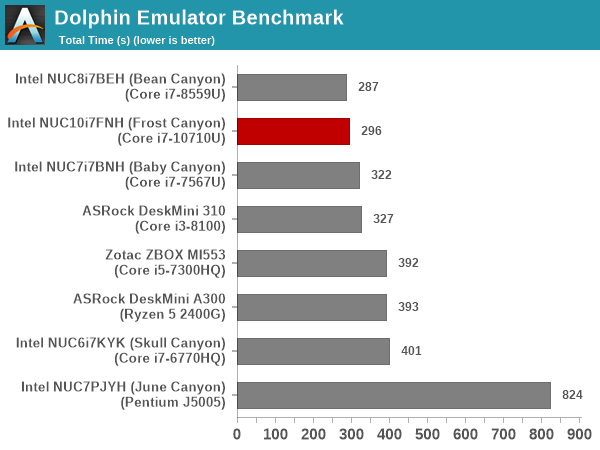
The benchmark is mostly bound by single-threaded performance, and we do not see much difference between the Bean Canyon and Frost Canyon NUCs in this workload.


85 Comments
View All Comments
PeachNCream - Monday, March 2, 2020 - link
Ganesh explained why the NUC was opened up in the article. Besides that, NUC systems are built to be user-accessible and are pretty simple to pull apart. It's like 4 screws to get the case open and pulling one ribbon cable off the motherboard to disconnect the mechanical drive. The barebones models are the same hardware and you have to crack the case to add storage or RAM or you do not have a complete computer.nico_mach - Tuesday, March 3, 2020 - link
I don't actually disagree with his reasoning, but I definitely have mixed feelings as a review.I forgot about the Atom NUCs completely. There's a name I haven't heard in a long time.
watzupken - Monday, March 2, 2020 - link
With the new AMD APU arriving this year, I wonder if this is dead in the water considering the higher cost of the NUC. 14nm+++ is not going to save Intel when facing off 7nm from AMD as shown in the current processor stack from both teams.timecop1818 - Monday, March 2, 2020 - link
"7nm".Intel's "14nm+++++" (keep adding pluses, retards) is closer to 10nm than AMD's crap.
Fulljack - Monday, March 2, 2020 - link
while fabrication nomenclature are now nowhere near it's actual marketed size, Intel's 14nm are still nowhere close with their own 10nm, and couldn't compete with TSMC's 7nmQasar - Monday, March 2, 2020 - link
keep posting useless, anti amd, crap. keep showing the rest of us, and demonstrate to the world that you are a nitwit, then we will let you hang yourself, king oft trollsLord of the Bored - Thursday, March 5, 2020 - link
Isn't this copy/paste'd from one of your other shill threads? Come on, man. Intel isn't paying you to repost the same old bullshit, your fans demand new content!Korguz - Thursday, March 5, 2020 - link
timecop1818 cant post new content, cause it doesnt have any.xenol - Monday, March 2, 2020 - link
The NUC product line is sort of dead in the water any way, I'd argue.YB1064 - Monday, March 2, 2020 - link
It would be helpful to include a small table that of benchmarks vs CPU performance scaling. Perhaps this is hard to do, but as a naive simple example:Benchmark#1 - scales with threads/cores
Benchmark#2 - scales with clocks/IPC
This is most likely highly complicated, but if anybody can do it, it is you guys. Ian, care to take a stab?