The ASRock DeskMini A300 Review: An Affordable DIY AMD Ryzen mini-PC
by Ganesh T S on April 26, 2019 8:00 AM ESTUL Benchmarks - PCMark, 3DMark, and VRMark
This section deals with a selection of the UL Futuremark benchmarks - PCMark 10, PCMark 8, 3DMark, and VRMark. While the first two evaluate the system as a whole, 3DMark and VRMark focus on the graphics capabilities.
PCMark 10
UL's PCMark 10 evaluates computing systems for various usage scenarios (generic / essential tasks such as web browsing and starting up applications, productivity tasks such as editing spreadsheets and documents, gaming, and digital content creation). We benchmarked select PCs with the PCMark 10 Extended profile and recorded the scores for various scenarios. These scores are heavily influenced by the CPU and GPU in the system, though the RAM and storage device also play a part. The power plan was set to Balanced for all the PCs while processing the PCMark 10 benchmark.
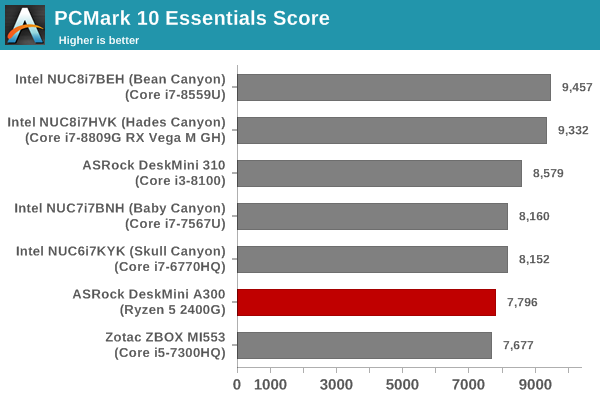
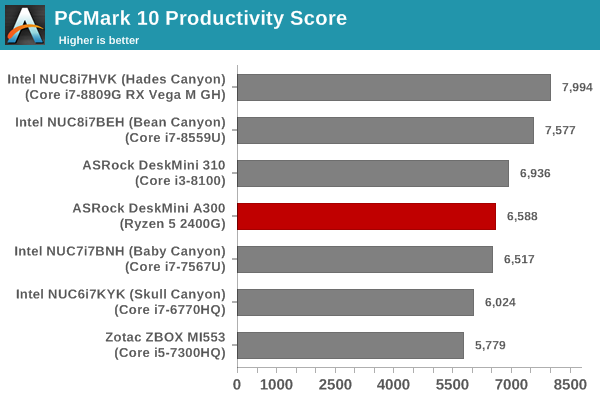
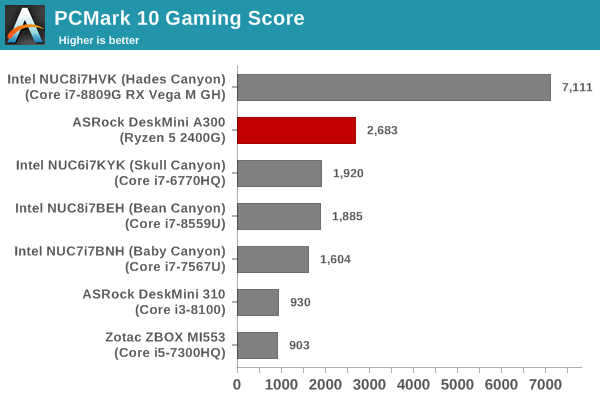
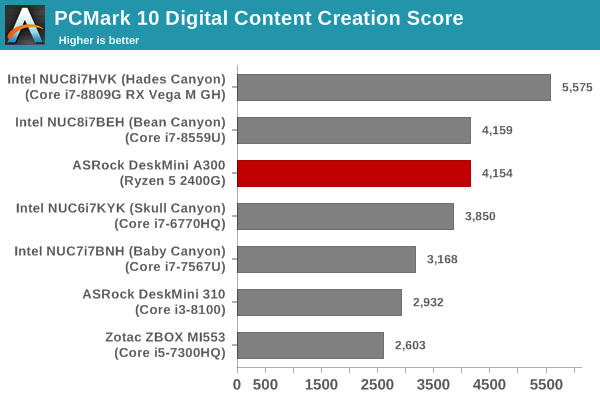
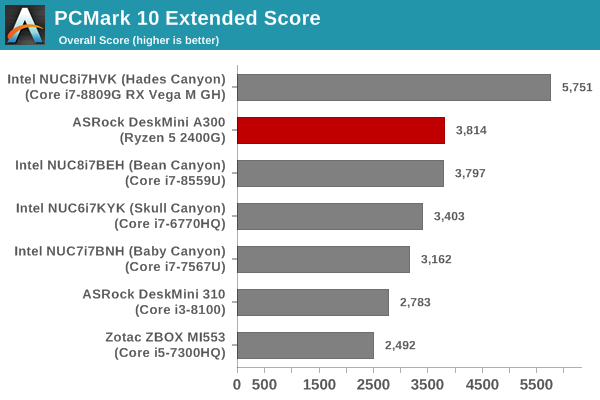
The Essentials and the Productivity scores reflect what was observed in the BAPCo SYSmark 2018 benchmarks. The higher single-threaded performance in the Core i3-8100 helps it edge ahead of the Ryzen 5 2400G. However, the gaming workload is a huge win for the DeskMini A300. The help from the multi-threaded performance also helps the system in the Digital Content Creation workload. Overall, we see the DeskMini A300 ending up with the best overall score amongst the systems without a discrete GPU.
PCMark 8
We continue to present PCMark 8 benchmark results (as those have more comparison points) while our PCMark 10 scores database for systems grows in size. PCMark 8 provides various usage scenarios (home, creative and work) and offers ways to benchmark both baseline (CPU-only) as well as OpenCL accelerated (CPU + GPU) performance. We benchmarked select PCs for the OpenCL accelerated performance in all three usage scenarios.
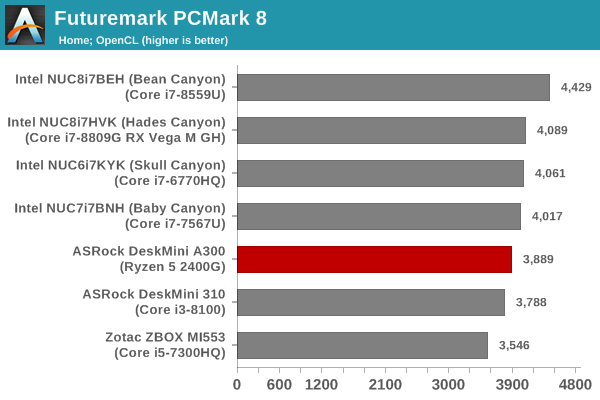
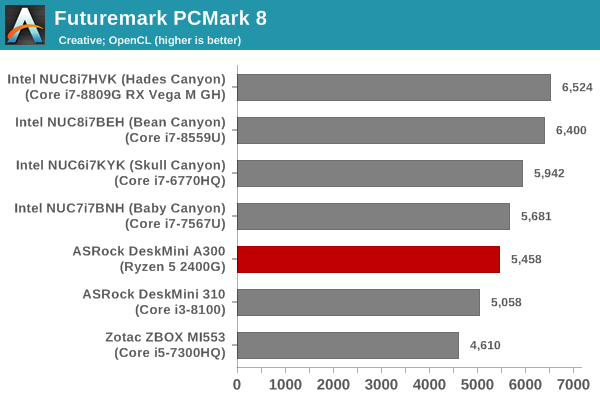
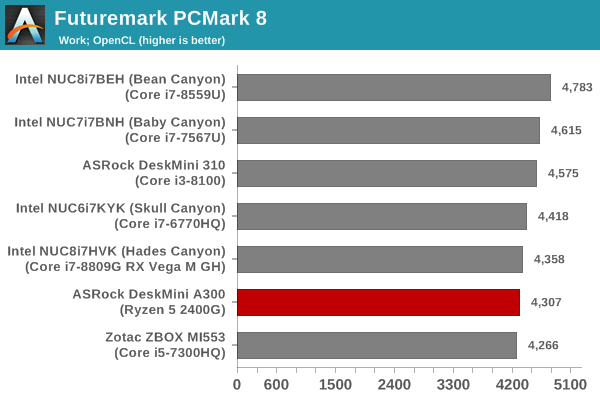
These scores are heavily influenced by the CPU in the system, and don't have a reliance on the gaming prowess to help the DeskMini A300 to get ahead. As a result, we see that the relative ordering is similar to what was observed in the BAPCo SYSmark 2018 benchmark.
3DMark
UL's 3DMark comes with a diverse set of graphics workloads that target different Direct3D feature levels. Correspondingly, the rendering resolutions are also different. We use 3DMark 2.4.4264 to get an idea of the graphics capabilities of the system. In this section, we take a look at the performance of the ASRock DeskMini A300 across the different 3DMark workloads.
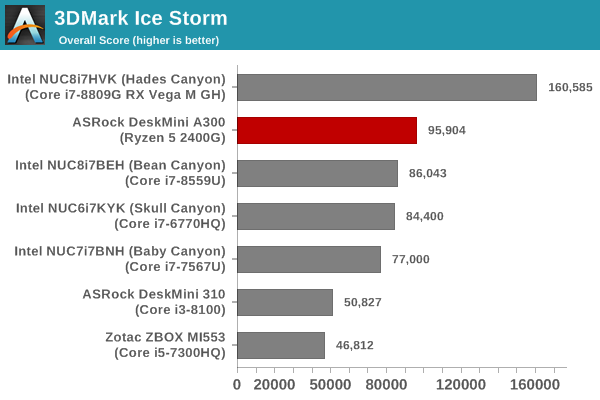
3DMark Ice Storm
This workload has three levels of varying complexity - the vanilla Ice Storm, Ice Storm Unlimited, and Ice Storm Extreme. It is a cross-platform benchmark (which means that the scores can be compared across different tablets and smartphones as well). All three use DirectX 11 (feature level 9) / OpenGL ES 2.0. While the Extreme renders at 1920 x 1080, the other two render at 1280 x 720. The graphs below present the various Ice Storm workload numbers for different systems that we have evaluated. Except for the Physics workload (CPU-reliant), the DeskMini A300 only lags behind the Hades Canyon NUC.
| UL 3DMark - Ice Storm Workloads | |||
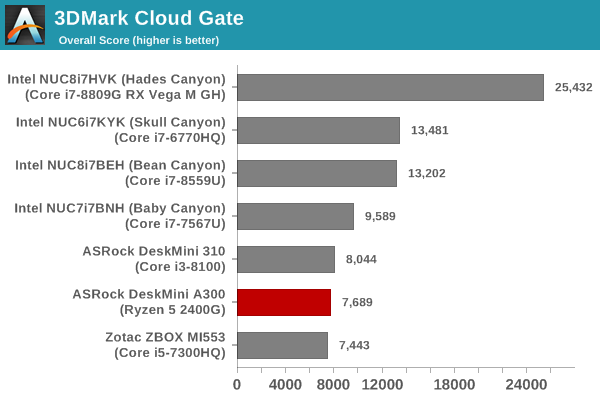
3DMark Cloud Gate
The Cloud Gate workload is meant for notebooks and typical home PCs, and uses DirectX 11 (feature level 10) to render frames at 1280 x 720. The graph below presents the overall score for the workload across all the systems that are being compared. Interestingly, the DeskMini A300 only performs as well as the DeskMini 310 for this low-complexity workload.
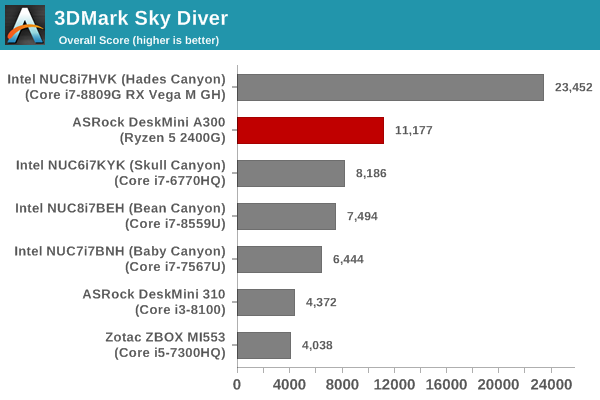
3DMark Sky Diver
The Sky Diver workload is meant for gaming notebooks and mid-range PCs, and uses DirectX 11 (feature level 11) to render frames at 1920 x 1080. The graph below presents the overall score for the workload across all the systems that are being compared. The DeskMini A300 again wins easily and turns out to be better than all other systems without a discrete GPU.
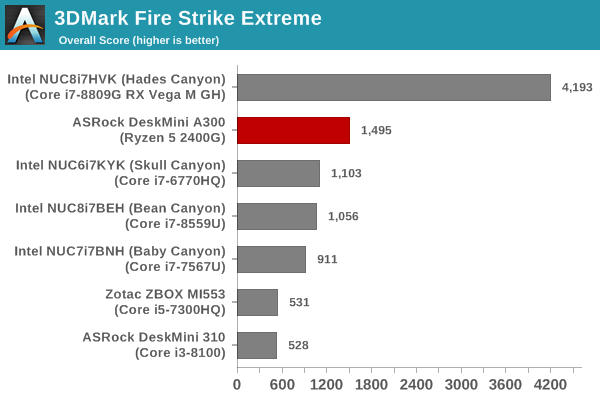
3DMark Fire Strike Extreme
The Fire Strike benchmark has three workloads. The base version is meant for high-performance gaming PCs. Similar to Sky Diver, it uses DirectX 11 (feature level 11) to render frames at 1920 x 1080. The Ultra version targets 4K gaming system, and renders at 3840 x 2160. However, we only deal with the Extreme version in our benchmarking - It renders at 2560 x 1440, and targets multi-GPU systems and overclocked PCs. The graph below presents the overall score for the Fire Strike Extreme benchmark across all the systems that are being compared. The DeskMini A300 is again the best system with an integrated GPU for this workload.
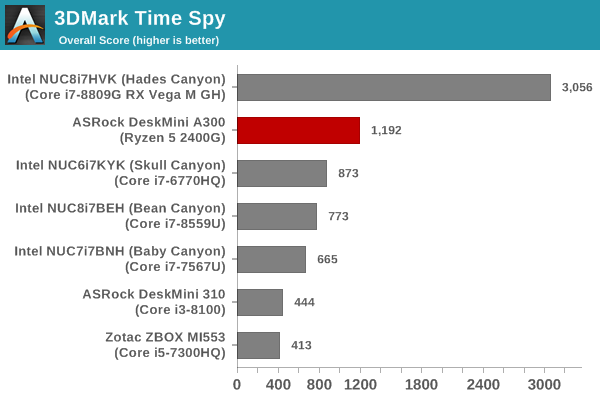
3DMark Time Spy
The Time Spy workload has two levels with different complexities. Both use DirectX 12 (feature level 11). However, the plain version targets high-performance gaming PCs with a 2560 x 1440 render resolution, while the Extreme version renders at 3840 x 2160 resolution. The graphs below present both numbers for all the systems that are being compared in this review. As expected, the DeskMini A300 is again on top (not considering systems with a discrete GPU).
| UL 3DMark - Time Spy Workloads | |||
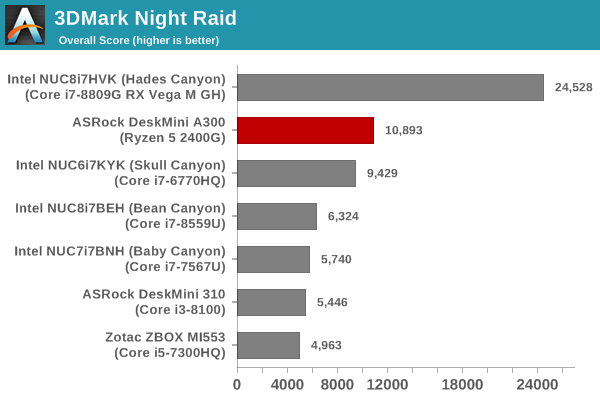
3DMark Night Raid
The Night Raid workload is a DirectX 12 benchmark test. It is less demanding than Time Spy, and is optimized for integrated graphics. The graph below presents the overall score in this workload for different system configurations.
VRMark
The DeskMini A300 is not a VR-ready PC by any stretch of imagination. However, it is still relevant to look at how the system performs for VR workloads. The VRMark Professional Edition v1.2.1701 comes with three rooms. Each room can be run either in desktop or HMD mode, with varying minimum requirements for the same workload. The benchmark results include the average FPS achieved, and a score based on the FPS. A pass or fail indicator is also provided based on whether the average FPS exceeds the required FPS. In this section, we take a look at the performance of the ASRock DeskMini A300 on a comparative basis across the three workloads in desktop mode.
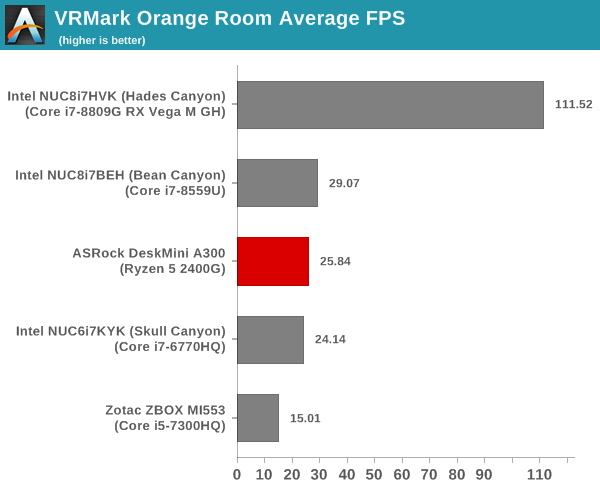
VRMark Orange Room
The Orange Room is meant to test the effectiveness of a system for handling the requirements of the HTC Vive and the Oculus Rift. The recommended hardware for both VR HMDs should be able to easily achieve the desired target FPS (88.9 fps). However, in the desktop mode, the target performance is 109 fps without any frame drops. Systems benching with an average FPS lesser than that are deemed to have failed the VRMark Orange Room benchmark. The graphs below present the average FPS and score for the different systems being considered today.
| UL VRMark - Orange Room | |||
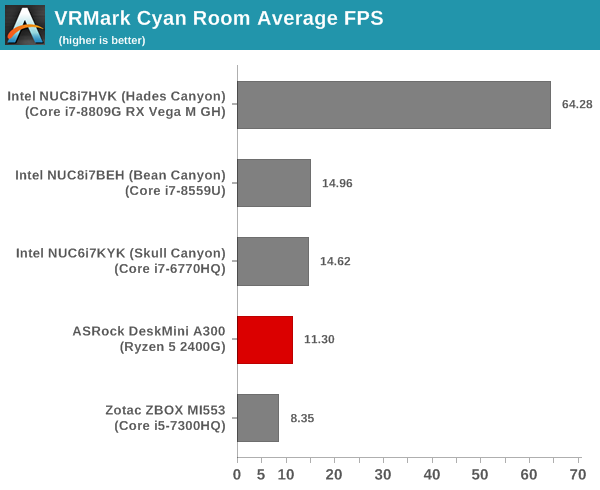
VRMark Cyan Room
The Cyan Room sits between the Orange and Blue rooms in complexity. It is a DirectX 12 benchmark. Similar to the Orange room, the target metrics are 88.9 fps on HMDs and 109 fps on the desktop monitor. The graphs below present the average FPS and score for the different systems being considered today.
| UL VRMark - Cyan Room | |||
VRMark Blue Room
The Blue Room is the most demanding of the three workloads. At the time of introduction of VRMark in October 2016, no publicly available system running as sold was able to pass the test. The performance of a system in this benchmark is an indicator of its VR-readiness for future generation of HMDs. Similar to the other workloads, the passing performance metrics are 88.9 fps on HMDs and 109 fps on desktop monitors. The complexity of the workload is due to the higher resolution (5012 x 2880) and additional geometry making it necessary to increase the number of Direct3D API calls. The graphs below present the average FPS and score for the different systems being considered today.
| UL VRMark - Blue Room | |||
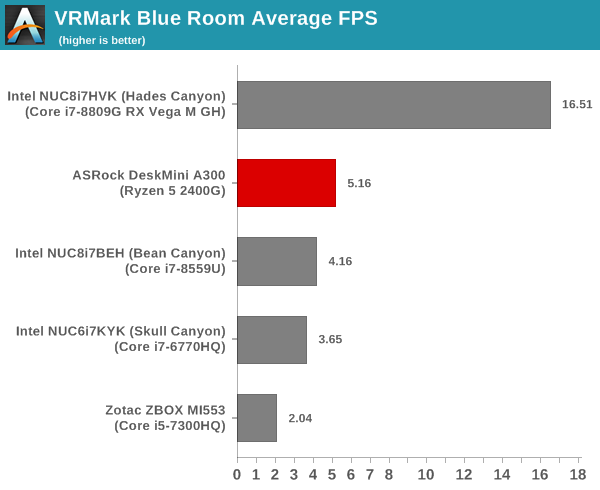
The CPU power also plays a role in the numbers for these complex workloads. So, we see that the DeskMini A300 doesn't enjoy as clear a lead as it did in the 3DMark workloads.


88 Comments
View All Comments
Irata - Thursday, May 2, 2019 - link
True about the system. Memory was good, but the SSD was a slower one.Basically, I would really like to see premium components being used in AMD based systems just like in Intel systems (or you could do it the other way around to reach the same price).
mikato - Thursday, May 2, 2019 - link
My price comparison cancelled out the reviewer's choices of memory and SSD. Those are things each person can choose.suraj jha - Wednesday, May 1, 2019 - link
Quickbooks online support is the best smarter business tools which resolves any issues in business accounting software. Here you may benefited by phone or post queries. https://www.quickbookspayrollonline.com/duartix - Thursday, May 2, 2019 - link
I've searched the whole article for the word "Noise" and I couldn't find a single reference. :(On a HTPC perspective, noise can be a determining factor.
How will it stack up when compared to Intel NUCs?
sor - Thursday, May 2, 2019 - link
It’s very quiet while gaming, at least if you use the wraith cooler. Much quieter than any video card (aside from fabless ones of course. Not completely inaudible but quieter than my MacBook Pro.mikato - Friday, May 3, 2019 - link
Thank you! Now that is a good comparison. I'm guessing it's quiet enough for me and my 6 foot HTPC situation. How about when not gaming? Is playing Youtube or Netflix or something basically not noticeable at all?alicetaylor - Monday, May 13, 2019 - link
great article, I was very impressed about it, wish you would have stayed next sharehttp://mutilateadoll2game.com
Dik - Sunday, July 14, 2019 - link
Will the ASRock A300 be coming out with USB 3.1 Gen 2? Can this be a BIOS upgrade? or it a feature of the chipset? I assume you can use the Rizen 3900X processor.Dik